Abstract
Analysis of the genetic diversity of super sweet corn inbred lines using SSR and SSAP markers
Author(s): W.R. Ko1*, K.J. Sa1*, N.S. Roy3, H.-J. Choi2 and J.K. Lee1In this study, we compared the efficiency of simple sequence repeat (SSR) and sequence specific amplified polymorphism (SSAP) markers for analyzing genetic diversity, genetic relationships, and population structure of 87 super sweet corn inbred lines from different origins. SSR markers showed higher average gene diversity and Shannon’s information index than SSAP markers. To assess genetic relationships and characterize inbred lines using SSR and SSAP markers, genetic similarity (GS) matrices were constructed. The dendrogram using SSR marker data showed a complex pattern with nine clusters and a GS of 53.0%. For SSAP markers, three clusters were observed with a GS of 50.8%. Results of combined marker data showed six clusters with 53.5% GS. To analyze the genetic population structure of SSR and SSAP marker data, the 87 inbred lines were divided into groups I, II, and admixed based on the membership probability threshold of 0.8. Using combined marker data, the population structure was K = 3 and was divided into groups I, II, III, and admixed. This study represents a comparative analysis of SSR and SSAP marker data for the study of genetic diversity and genetic relationships in super sweet corn inbred lines. Our results would be useful for maize-breeding programs in Korea. In this study, we compared the efficiency of simple sequence repeat (SSR) and sequence specific amplified polymorphism (SSAP) markers for analyzing genetic diversity, genetic relationships, and population structure of 87 super sweet corn inbred lines from different origins. SSR markers showed higher average gene diversity and Shannon’s information index than SSAP markers. To assess genetic relationships and characterize inbred lines using SSR and SSAP markers, genetic similarity (GS) matrices were constructed. The dendrogram using SSR marker data showed a complex pattern with nine clusters and a GS of 53.0%. For SSAP markers, three clusters were observed with a GS of 50.8%. Results of combined marker data showed six clusters with 53.5% GS. To analyze the genetic population structure of SSR and SSAP marker data, the 87 inbred lines were divided into groups I, II, and admixed based on the membership probability threshold of 0.8. Using combined marker data, the population structure was K = 3 and was divided into groups I, II, III, and admixed. This study represents a comparative analysis of SSR and SSAP marker data for the study of genetic diversity and genetic relationships in super sweet corn inbred lines. Our results would be useful for maize-breeding programs in Korea.
Impact Factor an Index

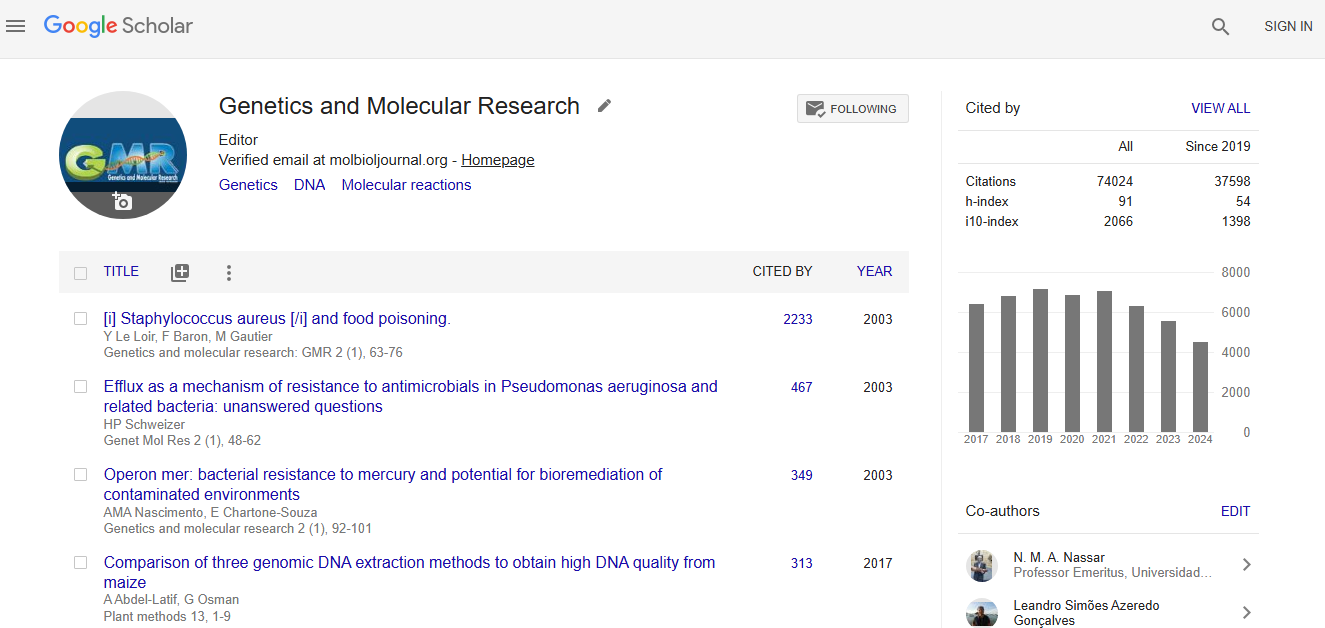
Google scholar citation report
Citations : 74024
Genetics and Molecular Research received 74024 citations as per google scholar report
