Behavior of soybean genotypes in three locations in the Triângulo Mineiro
Received: June 05, 2019
Accepted: June 15, 2019
Published: July 05, 2019
Genet.Mol.Res. 18(3):
Keywords
Adaptability; Foliar diseases; Genotypes; Glycine max; Stability.
Introduction
Soybean [Glycine max (L.) Merrill] stands as one of the main legumes grown in the world. At the moment, Brazil is the second largest producer of soybean, which is grown in all regions of the country. Soybean crops in Brazil produced 119.3 thousand tons in 2017/2018, in an area of 35.2 thousand hectares (CONAB, 2018). One of the aspects that require a constant increase in the supply of soybeans is the growing demand for food and environmental restrictions, which refrains the expansion of the agricultural frontier. Points to be reflected along with the environmental restrictions to the growth of soybean-producing areas in Brazil are the intensification of agriculture and the increasing productivity (Hirakuri et al., 2014).
A sustainable strategy for the productive performance of this culture is the genetic improvement, which aims, as its main objective, an enhanced productivity deriving from genetic and environmental effects, as well as the interaction between them. Associated to productivity is the stability of production and its broad adaptation in various regions and micro-regions (Polyzel et al., 2013). Regional studies are intended to mitigate the effects of environmental factors on release of new genotypes in different locations and/or times of sowing (Meotti et al., 2012). An important statistical parameter, which enables indirect selection, is the correlation between phenotypic characters. It measures the degree of linear association between two variables or a measure of the degree of joint variation, which can be positive or negative. Besides enabling indirect selection, correlations allow us to generate faster genetic gains compared to the use of direct selection (Cruz, Regazzi, Carneiro, 2012). In addition to productive aspects, stability and adaptability, genetic improvement of soybean aims to seek solutions in the presence of the biotic and abiotic factors which are major barriers to grain production. To achieve this, the main disease-resistant genes are aggregated to genotypes (Espíndola et al., 2011).
Foliar diseases are responsible for decreasing the amount of sound foliar tissue, leading to reduction of photosynthetic activity of leaves (Tsumanuma et al., 2010). In the final phase of the productive cycle several diseases may occur in soybean crops. One of the foliar diseases that have great potential to reduce the productive capacity of soybeans is septoriosis (Septoria glycines), frog-eye Stain (Cercospora sojina), powdery mildew (Microsphaera diffusa) and downy mildew (Peronospora manshurica) (EMBRAPA, 2014).
The present study aimed to evaluate soybean genotypes in different growing environments when it comes to agronomic characters and their resistance when reacting to leaf spots, and determine the adaptability and phenotypic stability of materials in relation to the place of cultivation.
Materials and Methods
The experiments were conducted in three cities: São Gotardo (latitude 19° and 20'S, longitude 46' W 0.3 and altitude of 1100 m), Uberaba (latitude 19° 59'S, longitude 47° 53'W, altitude of 764 m) and Uberlândia (latitude 18° 55'S, longitude 48º 17'W, altitude 872 m), during the period from October 2002 to April 2003. To achieve fertilization at planting, a chemical analysis of the soil was performed in each experimental area and conducted in accordance with the recommendation for soy culture. Formulated fertilizer 2/28/18 and zinc sulphate were used in doses of 400 Kg ha-1 and 1.2 Kg ha-1, respectively. Fertilizer application was held the day before to each sowing.
We evaluated 20 genotypes belonging to the Centro Tecnológico de Pesquisa Agropecuária do Estado de Goiás,all of them being in phase of VCU (value of cultivation and use). Some materials used were classified, according to Embrapa (2003) for Minas Gerais in: Medium cycle (101 to 110 days): Emgopa 316, Msoy 6101, BRSGO Caiapônia; Middle cycle (111 to 125 days): BRSGO Luziânia, BRSGO Santa Cruz, Msoy 8411; Medium late cycle (126 to 145 days): Msoy 8800, Emgopa 315 (Rio Vermelho); Late cycle (more than 145 days): BRSGO Paraíso, Emgopa 313, BRSGO Jataí, BRSGO Ipameri, BRSGO Chapadões. The remaining genotypes do not appear among the genotypes of soybean registered and indicated to the State of Minas Gerais: Emgopa 309 (Goiana), BRSMT Crixás, Emgopa 302, BRSGO Mineiros, Emgopa 314, BRSGO Goiatuba, BRSGO Bela Vista.
The experimental design was of randomized blocks, composed of the 20 × 3 factorial schemes, corresponding to the genotypes and cultivation sites, respectively, totalizing 60 treatments, each one composed by four repetitions. Each plot was composed of 6 rows, 5.0 m long each, with a space of 0.45 m between them, totalizing 240 plots of 13.5 m2, and a useful area of 7.2 m2 per plot. The four centerlines were used as useful experimental plots, discarding two rows and 0, 5 m at the top of each parcel in each row.
The day before planting the seeds were inoculated with Biomax ®, at a ratio of 7 × 10⁸ cells ml-1 of Bradirhizobium per seed, using 150 ml for every 50 kg of seed. Seed strains present in the Inoculants were: SEMIA 5079 e SEMIA 5080. Tillage was done through one plowing and two harrowings, being the last harrowing made on the day before furrowing, planting and fertilizing. Later, on 11/16/02 (São Gotardo), 11/22/02 (Uberlândia) and 11/23/02 (Uberaba), seeding was done 2 cm deep, using 20 seeds per linear meter, evenly.
Twenty days after seeding, we proceeded to the thinning of the plants, leaving only 15 plants per linear meter. And in the course of the experiment, whenever necessary, weeding was done by hoeing. Sprays with insecticides were performed, in the doses recommended by the manufacturers, to control crop pests. The agronomic characters evaluated were: number of days on flowering and maturity, plant height at flowering and maturation, height of insertion of the first pod and productivity, following the methodology used by Cunha (2003), based on the phenological stage of the plant.
Number of days to flowering (NDF)
Defined as the number of days counted from emergence to flowering, when approximately 50% of the plants in the plot presented at least one useful open flower (R1).
Number of days at maturity (NDM)
The number of days considered are counted from emergence until maturity, when 95% of the pods in the useful area of the parcel were ripe and showing the typical staining of the cultivar (R8).
Plant height at flowering (APF)
It is measured in centimeters from the soil surface to the end of the main stem, at the time of flowering.
Altura da planta na maturidade (APM)
It is the distance in centimeters from the soil surface to the end of the main stem of 10 randomly drawn plants when they were in the reproductive stage R8, where 95% of pods reached mature pod color.
Height of insertion of the first pod (AIPV)
It is the distance in centimeters from the surface of the soil to the insertion of the first pod, measured in 10 plants when they are in R8 stadium. Grain yield (RG): Evaluated through the harvesting the useful area in each parcel and the weighing of grain obtained. The data obtained (grams per plot) were transformed into kg ha-1.
Lodging (AC)
It was evaluated at maturity, and indicates the slope of the main stem obeying a scale (Sediyama, 1996): Almost all plants upright; Plants at a slight angle or some plants lodged; moderately inclined plants or 25 to 50% of plants lodged; Plants considerably inclined or 50 to 80% of plants lodged; All plants lodged. It was considered a lodged plant that one which showed an inclination angle greater than 45° from the vertical.
Severity of foliar diseases
Severity of foliar disease was assessed, being evaluated the Septoriosis (Septoria glycines), frog-eye Stain (Cercospora sojina) and downy mildew (Peronospora manshurica) in São Gotardo; Frog-eye stain (c. sojina), powdery mildew (Microsphaera diffusa) and downy mildew (p. manshurica) in Uberaba; and Septoriosis (s. glycines), powdery mildew (m. diffusa) and downy mildew (p. manshurica) in the city of Uberlandia. Evaluations were first carried out 61 days after sowing, and later one assessment was performed in each locality every two weeks, totaling three evaluations per site.
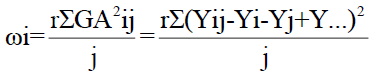
The diseases evaluated were of natural occurrence, having been assigned grades of severity, the genotypes were classified into immune (I) resistant (R), moderately resistant (MR) and susceptble (S), basing on the evolution of the disease in accordance with the procedure adopted by Juliatti and Polizel (2004). Ranging from 1 to 5, where: 1 = absence of symptoms on the leaves; 2 = disease present in lower leaves, with up to 25% of the leaf area affected; 3 = disease occurring up to the middle third, with up to 50% of leaf area affected; 4 = disease ocurring up to the top third with up to 75% of leaf area affected and 5 = disease reaching the whole aerial part, i.e., 100% of leaf area affected. The notes obtained from foliar diseases were transformed into percentage by calculating the area under the disease progress curve (AACPD). All data of agronomic characters and AACPD were submitted to Prophet Software to check for normality and homogeneity of variances. By checking such data, an analysis of variance was carried out, the average of the treatments being compared through the Tukey test. All analyses were done using the Statistical Analysis System SANEST (Sárries et al., 1992). Through the averages obtained for severity of powdery mildew, downy mildew, Brown stain and frog-eye stain, the genotypes were classified in moderately resistant, resistant and susceptible (Polizel et al., 2003). Afterwards, the phenotypical adaptability and stability of agronomic characters were estimated. To this end, we adopted the method proposed by Wricke (1965) breaking down the sum of squares of the interaction genotype × environment in parts due to isolated genotypes. The partition is made by using the statistic ωi, given by:
 (1)
(1)
Where:
Yij: Genotype i in the media environment j
Yi: The average genotype i
Yj: The average environment j
Y..: Overall average.
Results
Through the data from the analysis of variance (Table 1), it was noted that there was significant influence of the interaction genotype × local of cultivation on the NDF variables, AIPV, APM and AC. Regarding NDM there was a significant effect on cultivar and local, at 1% probability, while for RG only the local showed some significance, through the F test, at 1% probability.
| Sources | Degrees freedom | Medium Squares | ||||||||
|---|---|---|---|---|---|---|---|---|---|---|
| Variation | N.D.F. | N.D.M. | A.I.P.V.1/ | A.P.M1 | AC.2/ | R.G.1/ | ||||
| Genotypes | 19 | 686.5** | 2024.0** | 1.12** | 3.88** | 1.69** | 45.33 | |||
| Location | 2 | 3502.9** | 1022.5** | 4.31** | 8.33** | 14.73** | 2113.3** | |||
| C × L | 38 | 50.9** | 47.5* | 0.36* | 0.58** | 0.64** | 57.59 | |||
| Residue | 177 | 26.1 | 113.8 | 0.21 | 0.27 | 0.24 | 68.21 | |||
| Coefficient of variation | 8.63 | 8.10 | 9.58 | 5.23 | 15.08 | 15.45 | ||||
**; * Significant - 5% and 1% probability for the F test. respectively.
1/ Data transformed in (% +1.0) 1/2.
3/ Data transformed in log (x + 10)
N.D.F.: Number of days to flowering; N.D.M.: Number of days to maturity; A.I.P.V.: Height of insertion of the first pod; A.P.M.: Plant height at maturity; AC.: Lodging and R.G.: Grain Yield.
Table 1: Summary of the analysis of the data obtained in the experiment. with twenty genotypes and three locals of cultivation of soybeans, UFU, Uberlândia, MG, 2004
By means of the average number of days to flowering, presented in Table 2 it was noted that, in São Gotardo, genotypes Emgopa 313 and BRSGO Jataí presented a higher number of days to flowering. In Uberaba, only the material Emgopa 314 showed this result, while in Uberlândia prominent genotype was BRSGO Paraiso. As for the least number of days to flowering, it was observed that BRSGO Caiapônia and BRSGO Mineiros demonstrated this result at all locations of cultivation while other materials were earlier to bloom, this characteristic being intrinsic to the place of cultivation.
| Genotypes | Cultivation Site | ||||||
|---|---|---|---|---|---|---|---|
| São Gotardo | Uberaba | Uberlândia | |||||
| Early Cycle | |||||||
| Emgopa 316 | 63.00 cdeA | 49.00 cB | 44.00 cdB | ||||
| Msoy 6101 | 53.00 eA | 49.00 cAB | 43.00 cdB | ||||
| BRSGO Caiapônia | 52.00 eA | 49.00 cA | 39.50 dB | ||||
| Medium Cycle | |||||||
| BRSGO Luziânia | 67.00 bcdA | 57.00 abcB | 55.00 bcB | ||||
| BRSGO Santa Cruz | 64.25 bcdeA | 56.50 abcAB | 54.25 bcB | ||||
| Msoy 8411 | 75.00 abcA | 58.50 abcB | 62.50 abB | ||||
| Medium-late Cycle | |||||||
| Msoy 8800 | 73.00 abcdA | 63.00 abB | 63.00 abB | ||||
| Emgopa 315 | 69.00 abcdA | 57.50 abcB | 58.00 abB | ||||
| Late Cycle | |||||||
| BRSGO Paraíso | 76.00 abA | 62.50 abB | 68.50 aAB | ||||
| Emgopa 313 | 80.00 aA | 59.50 abcB | 64.00 abB | ||||
| BRSGO Jataí | 80.00 aA | 59.50 abcB | 63.25 abB | ||||
| BRSGO Ipameri | 67.00 bcdA | 56.50 abcB | 55.00 bcB | ||||
| BRSGO Chapadões | 61.00 deA | 53.50 abcA | 55.00 bcA | ||||
| Other genotypes | |||||||
| Emgopa 309 | 64.50 bcdeA | 53.50 abcB | 43.25 cdC | ||||
| BRSMT Crixás | 71.25 abcdA | 55.75 abcB | 55.00 bcB | ||||
| Emgopa 302 | 54.00 eA | 50.50 bcA | 36.50 dB | ||||
| BRSGO Mineiros | 53.00 eA | 49.00 cAB | 41.00 dB | ||||
| Emgopa 314 | 70.50 abcdA | 63.75 aAB | 58.00 abB | ||||
| BRSGO Goiatuba | 68.25 abcdA | 62.50 abA | 64.00 abA | ||||
| BRSGO Bela Vista | 72.25 abcdA | 63.00 abB | 63.75 abAB | ||||
1Averages followed by the same lowercase letter, vertically, and uppercase letter, horizontally do not differ, at 5% probability, by Tukey test,
Table 2: Average number of days to flowering. obtained in the experiment. according to the cultivar and cultivation site, UFU, Uberlândia, MG, 2004
The average number of days to maturity showed that the genotypes BRSGO Caiapônia, BRSGO Mineiros, Msoy 6101 and Emgopa 302 were the earliest materials featuring a shorter period to mature. However, the material BRSGO Paraíso proved to be late with the highest number of days to maturity (Table 3).
| Genotype | Averages |
|---|---|
| Early Cycle | |
| Emgopa 316 | 117.25 fg |
| Msoy 6101 | 111.08 g |
| BRSGO Caiapônia | 114.17 g |
| Medium Cycle | |
| BRSGO Luziânia | 130.83 cdef |
| BRSGO Santa Cruz | 130.92 cdef |
| Msoy 8411 | 133.75 abcde |
| Medium-late Cycle | |
| Msoy 8800 | 139.42 abcde |
| Emgopa 315 | 130.67 def |
| Late Cycle | |
| BRSGO Paraíso | 147.50 a |
| Emgopa 313 | 146.33 abc |
| BRSGO Jataí | 144.00 abcd |
| BRSGO Ipameri | 134.17 abcde |
| BRSGO Chapadões | 131.67 bcdef |
| Other genotypes | |
| Emgopa 309 | 124.08 efg |
| BRSMT Crixás | 134.50 abcde |
| Emgopa 302 | 110.58 g |
| BRSGO Mineiros | 111.92 g |
| Emgopa 314 | 145.83 abcd |
| BRSGO Goiatuba | 147.08 ab |
| BRSGO Bela Vista | 147.08 ab |
1 Averages followed by the same lowercase. vertically. do not differ, at 5% probability, by Tukey test.
Table 3: Average number of days to maturity. obtained in the experiment. depending on the cultivar,UFU, Uberlândia, MG, 2004
With regard to cultivation sites, it should be noted that in all the genotypes São Gotardo took longer to mature, while in Uberlândia maturation was more precocious, compared to other municipalities studied (Table 4). Table 5 shows average height of insertion of the first pod. It was noted that the genotypes BRSGO Mineiros, BRSGO Chapadões and Msoy 8411 presented the smallest results in São Gotardo, Uberaba and Uberlandia, respectively. A lower insertion of the first pod in soybean plants as well as its standardization, result in smaller losses during mechanized harvesting (between 10 and 15 cm). In relation to the cultivation site, it turns out that in Uberaba and Uberlandia, materials demonstrated a higher and lower height of insertion of the first pod, respectively (Table 5).
| Location of Cultivation | Medium |
|---|---|
| São Gotardo | 135.23a |
| Uberaba | 131.63ab |
| Uberlândia | 128.08 b |
Averages followed by the same lowercase letter vertically do not differ, at 5% probability, by Tukey test.
Table 4: Average number of days to maturity. obtained in the experiment. according to the place of cultivation.UFU, Uberlândia, MG, 2004
| Genotype | Cultivation site | |||||
|---|---|---|---|---|---|---|
| São Gotardo | Uberaba | Uberlândia | ||||
| Early Cycle | ||||||
| Emgopa 316 | 16.18 cdB | 25.17 abcA | 19.01 abAB | |||
| Msoy 6101 | 17.25 abcdA | 20.79 abcA | 23.41 abA | |||
| BRSGO Caiapônia | 19.21 abcdA | 25.74 abcA | 24.78 aA | |||
| Medium Cycle | ||||||
| BRSGO Luziânia | 21.95 abcdAB | 29.23 abA | 20.49 abB | |||
| BRSGO Santa Cruz | 18.12 abcdA | 19.64 abcA | 16.92 abA | |||
| Msoy 8411 | 26.09 abcA | 22.98 abcA | 14.26 bB | |||
| Medium-late Cycle | ||||||
| Msoy 8800 | 25.79 abcA | 24.88 abcA | 19.83 abA | |||
| Emgopa 315 | 22.99 abcdA | 25.59 abcA | 19.40 abA | |||
| Late Cycle | ||||||
| BRSGO Paraíso | 28.18 aA | 29.31 abA | 26.14 aA | |||
| Emgopa 313 | 22.91 abcdA | 23.08 abcA | 17.54 abA | |||
| BRSGO Jataí | 21.09 abcdA | 25.44 abcA | 19.57 abA | |||
| BRSGO Ipameri | 27.70 abA | 26.05 abcA | 20.61 abA | |||
| BRSGO Chapadões | 16.94 bcdA | 17.74 cA | 17.77 abA | |||
| Other genotypes | ||||||
| Emgopa 309 | 18.40 abcdA | 24.48 abcA | 18.46 abA | |||
| BRSMT Crixás | 18.07 abcdA | 18.14 bcA | 17.00 abA | |||
| Emgopa 302 | 17.08 abcdA | 21.63 abcA | 21.49 abA | |||
| BRSGO Mineiros | 13.76 dA | 19.62 abcA | 17.85 abA | |||
| Emgopa 314 | 22.42 abcdA | 21.06 abcA | 17.76 abA | |||
| BRSGO Goiatuba | 25.34 abcA | 30.84 aA | 17.24 abB | |||
| BRSGO Bela Vista | 26.89 abcA | 28.93 abcA | 22.40 abA | |||
Averages followed by the same lowercase letter, vertically, and uppercase letter, horizontally, do not differ, at 5% probability, by Tukey test.
Table 5: Average height of insertion of the first pod (cm). obtained in the experiment. according to the cultivar and cultivation site, UFU, Uberlândia, MG, 2004
Observing average plant height at maturation, it was noted that cultivar BRSGO Chapadões obtained a lower plant height at maturity, both in Uberaba and Uberlândia, whereas in São Gotardo it was BRSGO Mineiros which obtained this result. The largest plant heights in the maturation, in all locations were obtained by BRSGO Bela Vista e BRSGO Goiatuba. Other genotypes, such as Msoy 8411; Emgopa 314, BRSGO Caiapônia, BRSGO Paraíso, Msoy 8411; BRSGO Caiapônia presented more height at maturation, in São Gotardo, Uberaba and Uberlândia, respectively (Table 6).
| Genotype | Cultivation site | |||
|---|---|---|---|---|
| São Gotardo | Uberaba | Uberlândia | ||
| Early cycle | ||||
| Emgopa 316 | 76.45 deB | 100.82 abcA | 102.90 abcdA | |
| Msoy 6101 | 82.64 cdeB | 104.57 abcA | 100.02 abcdA | |
| BRSGO Caiapônia | 96.67 abcdB | 117.71 aA | 116.29 aA | |
| Medium cycle | ||||
| BRSGO Luziânia | 77.08 deB | 93.29 abcdA | 88.99 bcdAB | |
| BRSGO Santa Cruz | 87.32 bcdeA | 95.53 abcdA | 89.01 bcdA | |
| Msoy 8411 | 115.00 aA | 115.62 aA | 109.84 abcA | |
| Medium-late cycle | ||||
| Msoy 8800 | 102.72 abcA | 109.91 abA | 93.95 abcdA | |
| Emgopa 315 | 85.58 bcdeA | 94.82 abcdA | 87.64 bcdA | |
| Late cycle | ||||
| BRSGO Paraíso | 91.95 abcdeB | 116.42 aA | 112.88 abA | |
| Emgopa 313 | 93.54 abcdA | 103.75 abcA | 109.56 abcA | |
| BRSGO Jataí | 92.49 abcdeA | 93.92 abcdA | 99.66 abcdA | |
| BRSGO Ipameri | 89.06 abcdeA | 92.11 abcdA | 100.48 abcdA | |
| BRSGO Chapadões | 82.21 cdeA | 74.53 dA | 83.28 dA | |
| Other genotypes | ||||
| Emgopa 309 | 78.20 cdeA | 88.75 bcdA | 88.38 bcdA | |
| BRSMT Crixás | 79.95 cdeA | 79.34 cdA | 86.05 cdA | |
| Emgopa 302 | 79.25 cdeB | 110.30 abA | 101.83 abcdA | |
| BRSGO Mineiros | 68.94 eB | 109.20 abA | 104.27 abcdA | |
| Emgopa 314 | 109.54 abA | 117.12 aA | 105.30 abcdA | |
| BRSGO Goiatuba | 114.92 aA | 118.59 aA | 117.12 aA | |
| BRSGO Bela Vista | 115.17 aA | 116.92 aA | 116.24 aA | |
Averages followed by the same lowercase letter, vertically, and uppercase letter, horizontally, do not differ, at 5% probability, by Tukey test.
Table 6: Average plant height at maturation (cm), obtained in the experiment, according to the cultivar and cultivation site,UFU, Uberlândia, MG, 2004
With regard to cultivation sites, the lowest height of the plant at maturation was obtained in São Gotardo, while in the other two locations there was no significant difference, as seen in Table 6.
Analyzing lodging data, depending on the cultivar and cultivation site, it was observed in São Gotardo that Emgopa 315 suffered more lodging (Table 7). In Uberaba, the cultivar Emgopa 314 also demonstrated this result, while in Uberlândia, Msoy 8411 e Emgopa 302 were more lodged. As for the resistance to lodging, it was noted that BRSGO Paraíso e Msoy 8800 were the outstanding genotypes in São Gotardo and Uberlândia, respectively. In Uberaba, various materials were resistant concerning the variable in question: Emgopa 316, Msoy 8800, BRSGO Jataí e Emgopa 309.
| Genotype | Cultivation site | ||
|---|---|---|---|
| São Gotardo | Uberaba | Uberlândia | |
| Early cycle | |||
| Emgopa 316 | 25.00 abcdA | 0.00 bB | 24.66 abcdA |
| Msoy 6101 | 25.00 abcdA | 5.00 abB | 52.88 abA |
| BRSGO Caiapônia | 30.05 abcdA | 8.37 abA | 23.83 abcdA |
| Medium cycle | |||
| BRSGO Luziânia | 43.32 abA | 2.25 abB | 13.48 bcdAB |
| BRSGO Santa Cruz | 42.44 abA | 6.75 abB | 8.71 bcdB |
| Msoy 8411 | 64.47 aAB | 24.48 abB | 82.93 aA |
| Medium-late cycle | |||
| Msoy 8800 | 3.68 cdeA | 0.00 bA | 3.68 dA |
| Emgopa 315 | 51.02 aA | 10.52 abB | 30.58 abcdAB |
| Late cycle | |||
| BRSGO Paraíso | 0.00 eB | 2.25 abAB | 17.62 abcdA |
| Emgopa 313 | 2.25 deB | 5.00 abB | 42.44 abA |
| BRSGO Jataí | 6.41 bcdeB | 0.00 bB | 38.05 abcA |
| BRSGO Ipameri | 35.83 abcA | 6.75 abB | 21.60 abcdAB |
| BRSGO Chapadões | 35.83 abcA | 18.06 abA | 18.06 abcdA |
| Other genotypes | |||
| Emgopa 309 | 21.34 abcdeA | 0.00 bB | 5.00 cdAB |
| BRSMT Crixás | 35.83 abcA | 2.25 abB | 24.11 abcdA |
| Emgopa 302 | 25.00 abcdB | 18.30 abB | 82.93 aA |
| BRSGO Mineiros | 25.00 abcdA | 5.00 abB | 28.52 abcdA |
| Emgopa 314 | 13.11 abcdeA | 26.74 aA | 28.71 abcdA |
| BRSGO Goiatuba | 33.23 abcA | 5.00 abB | 34.77 abcdA |
| BRSGO Bela Vista | 15.59 abcdeA | 2.25 abA | 10.52 bcdA |
Averages followed by the same lowercase letter, vertically, and uppercase letter, horizontally, do not differ, at 5% probability, by Tukey test.
Table 7: Lodging averages (%) obtained in the experiment. according to the cultivar and cultivation site, UFU, Uberlândia, MG, 2004
In the study developed by the authors, in which soybean genotypes were evaluated in two cities in the State of Minas Gerais, Itutinga and Lavras, the average score of the genotypes evaluated ranged between 1 and 2. Evaluating varieties and strains of soybeans, Rocha et al. (2012) assessing the lodging index, obtained an average of 1 to 3.2 at the Scott-Knott test (P<0.05). Amorim et al. (2011) evaluated in his work that the seeding season influence on the lodging index of soy plants. In the first season, on October 30, the average was 1.57; in the second, on November 15, 1.88; in the third, on December 14, 2.45; and in the fourth, on, December 31, 1.00.
Considering the cultivation site, it was found, as demonstrated in Table 7, that in the city of Uberaba, there was a minor lodging, and in Uberlândia and São Gotardo plants were more lodged.
By the data of analysis of variance (Table 1) it was noted that there was no significant effect of cultivar and interaction cultivar × cultivation site, and only the cultivation site presented some significance, by the F test, at 1% and 5% probability. Although there is no influence of genotypes, no statistically significant difference occurring, it turns out that BRSGO Chapadões e Emgopa 314 were the genotypes that had higher and lower grain yield (kg ha-1) in the experiment, there being a difference of 812 kg ha-1 between both. The average grain yields of the genotypes studied are presented in Table 8. What can be observed is that there were no significant differences for this feature among the genotypes evaluated
| Genotypes | Averages |
|---|---|
| Early cycle | |
| Emgopa 316 | 2777.22 a |
| Msoy 6101 | 2692.69 a |
| BRSGO Caiapônia | 2883.60 a |
| Medium cycle | |
| BRSGO Luziânia | 3078.82 a |
| BRSGO Santa Cruz | 2973.77 a |
| Msoy 8411 | 2929.76 a |
| Medium-late cycle | |
| Msoy 8800 | 3194.07 a |
| Emgopa 315 | 3172.71 a |
| Late cycle | |
| BRSGO Paraíso | 2680.45 a |
| Emgopa 313 | 2773.99 a |
| BRSGO Jataí | 3013.06 a |
| BRSGO Ipameri | 2898.03 a |
| BRSGO Chapadões | 3280.44 a |
| Other genotypes | |
| Emgopa 309 | 2711.05 a |
| BRSMT Crixás | 2828.30 a |
| Emgopa 302 | 2719.10 a |
| BRSGO Mineiros | 2713.56 a |
| Emgopa 314 | 2467.99 a |
| BRSGO Goiatuba | 2711.05 a |
| BRSGO Bela Vista | 2751.27 a |
Averages followed by the same lowercase letter, vertically, do not differ, at 5% probability, by Tukey test.
Table 8: Average grain yields (kg ha-1), obtained in the experiment, depending on the cultivar, UFU, Uberlândia, MG, 2004
The overall average grain productivity was 3,337.00 kg ha-1. In the first location the most productive genotype was UFUS 22 (IAC 100 × Emgopa 302): 5,011.00 kg ha-1. In São Gotardo genotypes Conquista had the greatest productive performance: 4,420.00 kg ha-1. In the third place, an average of 5,009.00 kg ha-1 was obtained by genotype M-soy 8411, which was the most productive genotype. This same genotypes was the most productive in Uberlândia, 5,075.00 kg ha-1.
Considering the average grain yield data depending on the place of cultivation, it should be noted that the highest yields were obtained in Uberaba and Uberlândia, to the detriment of São Gotardo (Table 9).
| Cultivation Site | Average | |
|---|---|---|
| São Gotardo | 2257.13 b | |
| Uberaba | 3212.93 a | |
| Uberlândia | 3149.04 a | |
Averages followed by the same lowercase letter. vertically, do not differ, at 5% probability, by Tukey test.
Table 9: Average grain yield obtained in the experiment, according to the cultivation site. UFU, Uberlândia, MG, 2004
It can be observed by the data in Table 10 that the correlations RG × NDF, RG × APM, NDM, NDF × AIPV, NDM × AIPV, NDM × APM, NDM × AC, AIPV × APM and AIPV × AC were low despite significant, indicating that only some genotypes in the group analyzed suffered influence of another variable.
| RG | NDF | NDM | AIPV | APM | AC | |
|---|---|---|---|---|---|---|
| RG | 1.000 | -0.190** | -0.085 | -0.094 | 0.191** | -0.067 |
| NDF | 1.000 | 0.671** | 0.133* | 0.037 | -0.071 | |
| NDM | 1.000 | 0.169** | 0.142* | -0.145* | ||
| AIPV | 1.000 | 0.393** | -0.261** | |||
| APM | 1.000 | 0.068 | ||||
| AC | 1.000 |
*; * Significant *- at 5% and 1% probability, respectively.
NDF.: NUmber of days to flowering; NDM.: NUmber of days to maturity; AI: HEight of insertion of the first pod; AP: Plant Height at maturity; AC: Lodging and RG: Grain Yield.
Table 10: Correlation coefficients between the variables analyzed in the study, UFU, Uberlândia, MG, 2004
Data about reaction of genotypes to different pathogens are presented in Table 11. As for other pathogens the higher the resistance of genotypes to different pathogens is, the better it will be for the soybean producer, i.e. the amount of fungicide applications will be smaller, generating lower cost per hectare, and thus, greater profitability. Checking the data obtained in this experiment, it should be noted that the cultivar BRSGO Jataí was the most stable as for the planting sites, showing resistance and immunity to different pathogens. Other materials are worth mentioning, such as Msoy 8411, BRSGO Paraíso and BRSGO Chapadões.
| Cultivares | São Gotardo | Uberaba | Uberlândia | |||||||||
|---|---|---|---|---|---|---|---|---|---|---|---|---|
| Sept. | M.rã | Míld. | M.rã | Oíd. | Míld. | Sept. | Oíd. | Míld. | ||||
| Ciclo Semiprecoce | ||||||||||||
| Emgopa 316 | MR | MR | R | S | S | S | MR | I | R | |||
| Msoy 6101 | MR | S | I | S | S | S | S | S | R | |||
| Caiapônia1 | MR | MR | R | R | S | S | S | R | R | |||
| Ciclo Médio | ||||||||||||
| Luziânia1 | MR | MR | I | R | R | S | R | R | R | |||
| Santa Cruz1 | MR | MR | I | R | R | S | R | I | R | |||
| Msoy 8411 | R | MR | I | I | I | S | MR | I | R | |||
| Ciclo Semitardio | ||||||||||||
| Msoy 8800 | MR | MR | R | R | MR | S | MR | R | R | |||
| Emgopa 315 | R | MR | R | R | MR | S | R | R | R | |||
| Ciclo ardio | ||||||||||||
| Paraíso1 | MR | MR | I | I | I | I | R | I | I | |||
| Emgopa 313 | MR | MR | I | R | R | S | R | I | R | |||
| Jataí1 | MR | R | I | I | R | MR | MR | I | R | |||
| Ipameri1 | MR | MR | I | S | S | S | MR | R | R | |||
| Chapadões1 | MR | MR | I | I | MR | R | MR | R | I | |||
| Demais materiais | ||||||||||||
| Emgopa 309 | MR | MR | I | R | S | S | MR | R | R | |||
| BRSMT Crixás | MR | MR | I | R | S | MR | MR | S | I | |||
| Emgopa 302 | S | MR | I | I | S | S | S | R | R | |||
| Mineiros1 | MR | MR | I | R | S | S | S | R | I | |||
| Emgopa 314 | R | MR | R | R | R | S | R | I | R | |||
| Goiatuba1 | MR | MR | R | R | S | S | R | R | R | |||
| Bela Vista1 | MR | MR | I | R | S | S | MR | S | S | |||
Sept.: Septoriose (Septoria glycines); M.rã: Mancha olho-de-rã (Cercospora sojina); Oíd.: Oídio (Microsphaera diffusa); Míld.: Míldio (Peronospora manshurica).
I: Imune; R: Resistente; MR: Moderadamente Resistente. S: Suscetível.
Table 11: Reaction of soybean genotypes on the reaction to leaf spot in several places, UFU, Uberlândia, 2004
In Table 11, considering frog-eye stain, genotypes Emgopa 316 and BRSGO Ipameri, in Uberaba, and Msoy 6101, in São Gotardo and Uberaba, showed susceptibility to the fungus Cercospora sopna.
Analysis of phenotypic stability and adaptability, grain yields (kg ha '), lodging (%), plant height (cm) at maturation, height of insertion of the first pod (cm), number of days to flowering and maturity, assessed by the Wricke method (1965), can be found in Table 12.
| Genotypes | Grain yield | Lodging | APM | AIPV | NDM | NDF | ||||||
|---|---|---|---|---|---|---|---|---|---|---|---|---|
| Wi | Wi(%) | Wi | Wi(%) | Wi | Wi(%) | Wi | Wi(%) | Wi | Wi(%) | Wi | Wi(%) | |
| Emg309 | 1088.32 | 0.02 | 324.17 | 4.66 | 4.23 | 0.19 | 5.74 | 1.87 | 9.63 | 2.1 | 47.69 | 9.25 |
| Jatai | 123247.87 | 0.19 | 267.55 | 3.84 | 65.31 | 2.88 | 1.75 | 0.57 | 9.23 | 2.01 | 57.23 | 11.46 |
| Caiapônia | 74695.6 | 1.06 | 49.61 | 0.71 | 59.01 | 2.6 | 27.17 | 8.84 | 31.25 | 6.82 | 33.15 | 6.64 |
| Emg313 | 100711.29 | 1.43 | 495.07 | 7.11 | 40.37 | 1.78 | 6.7 | 2.18 | 3.65 | 0.8 | 57.23 | 11.46 |
| Luziânia | 101090.90 | 1.44 | 342.36 | 9.22 | 11.37 | 0.5 | 13.43 | 4.37 | 11.72 | 2.56 | 0.08 | 0.02 |
| Emg314 | 112988.26 | 1.61 | 495.86 | 7.12 | 85.45 | 3.76 | 7.91 | 2.57 | 3.47 | 0.76 | 7.28 | 1.46 |
| Emg315 | 232864.09 | 3.31 | 386.36 | 5.55 | 20.86 | 0.92 | 2.03 | 0.66 | 3.59 | 0.78 | 4.1 | 0.82 |
| St Cruz | 255909.73 | 3.64 | 592.61 | 8.51 | 29.09 | 1.28 | 1.59 | 0.52 | 7.75 | 1.69 | 3.43 | 0.69 |
| Crixás | 264350.18 | 3.76 | 99.36 | 1.43 | 82.23 | 3.62 | 5.76 | 1.87 | 5.56 | 1.21 | 126.24 | 3.25 |
| Emg316 | 270929.07 | 3.85 | 13.8 | 0.2 | 172.12 | 7.58 | 21.97 | 7.14 | 141.17 | 30.79 | 22.64 | 4.53 |
| Msoy6101 | 337407.04 | 4.8 | 501.73 | 7.21 | 287.06 | 12.65 | 38.65 | 12.57 | 7.09 | 1.55 | 18.05 | 3.62 |
| Emg302 | 396195.20 | 5.63 | 1643.84 | 23.61 | 194.46 | 8.57 | 20.05 | 6.52 | 9.41 | 2.05 | 68.02 | 13.62 |
| Mineiros | 400366.81 | 5.69 | 22.44 | 0.32 | 507.1 | 22.34 | 17.23 | 5.6 | 16.36 | 3.57 | 22.481 | 4.5 |
| Ipameri | 420675.87 | 5.98 | 77.55 | 1.11 | 67.33 | 2.97 | 15.5 | 5.04 | 40.87 | 8.91 | 0.38 | 0.08 |
| Msoy8800 | 442813.11 | 6.3 | 170.1 | 2.44 | 156.94 | 6.91 | 9.86 | 3.21 | 74.2 | 16.19 | 3.76 | 0.75 |
| B. Vista | 566050.26 | 8.05 | 102.86 | 1.48 | 51.16 | 2.25 | 5.25 | 1.71 | 34.49 | 7.52 | 8.26 | 1.56 |
| Paraíso | 576347.06 | 8.19 | 313.17 | 4.5 | 106.88 | 4.71 | 1.43 | 0.46 | 28.51 | 6.22 | 35.22 | 7.05 |
| Goiatuba | 581929.54 | 8.27 | 62.24 | 0.89 | 34.82 | 1.53 | 46 | 14.96 | 7.74 | 1.69 | 32.58 | 6.53 |
| Msoy8411 | 887979.89 | 12.62 | 360.35 | 5.17 | 102.69 | 4.52 | 49.8 | 16.19 | 0.68 | 0.15 | 27.75 | 5.56 |
| Chapadões | 996350.95 | 14.16 | 342.39 | 4.92 | 191.2 | 8.42 | 9.69 | 3.15 | 12.06 | 2.63 | 33.77 | 6.76 |
APM: Plant Height in the maturation; AIPV: Height of insertion of the first pod. NDM: Number of days to maturity; NDF: Number of days to flowering.
Table 12: Adaptability and stability of soybean genotypes as for grain yield (kg ha-1), lodging (%), plant height at maturation, height of insertion of the first pod (cm), number of days to flowering, and number of days to maturation, according to the Wricke ecovalence method, UFU, Uberlândia, 2004
As for the variable grain yield the most stable materials (in descending) order were: Emgopa 309. BRSGO Jataí, BRSGO Caiapônia, Emgopa 313, BRSGO Luziânia, Emgopa 314, Emgopa 315., BRSGO Santa Cruz, Crixás, Emgopa 316, Msov 6101, Emgopa 302, BRSGO Mineiros, BRSGO Ipameri, Msov 8800, BRSGO Bela Vista, BRSGO Paraíso, BRSGO Goiatuba, Msov 8411, BRSGO Chapadões.
Considering lodging, the order of the genotypes was: Emgopa 316 BRSGO Mineiros, BRSGO Caiapônia, BRSGO Goiatuba, BRSGO Ipameri, Crixás, BRSGO Bela Vista, Msov 8800, BRSGO Jataí, BRSGO Paraíso, Emgopa 309, BRSGO Chapadões, Msov,8411, Emgopa 315, Emgopa 313, Emgopa 314, Msoy 6101, BRSGO Santa Cruz, BRSGO Luziânia, Emgopa 302.
With respect to plant height at maturation, the genotypes presented the following descending order of stability: Emgopa 309, BRSGO Luziânia, Emgopa 315, BRSGO Santa Cruz, BRSGO Goiatuba, Emgopa 313, BRSGO Bela Vista, BRSGO Caiapônia, BRSGO Jataí, BRSGO Ipameri, Crixás, Emgopa 314, Msoy 8411, BRSGO Paraíso, Msoy 8800, Emgopa 316, BRSGO Chapadões, Emgopa 302, Msoy 6101 and BRSGO Mineiros. Genotypes Msoy 8411, BRSGO Goiatuba and Msoy 6101 genotypes were more unstable as for the height of insertion of the first pod.
As for the number of days to maturation the highest values of Wi% were found in varieties Emgopa 316 and Msoy 8800, while for the number of days to flowering Emgopa 313 presented the highest values. BRSGO Jatai e Emgopa 302 was the most unstable compared to other genotypes.
Discussion
Almeida et al. (2011) evaluated the performance of twelve soybean genotypes and, as for the number of days until flowering, the average time for BRS/MG Garantia cultivar was 41.67 days, being the later, and the earliest were DM Vitória and DM 247, (35 and 47 days respectively). Evaluating 48 soybean genotypes, Santos et al. (2011) concluded that this character has generated greater discrimination in analysis between the genotypes, being observed as well, greater variability among them, the earliest genotype was BRS 216 (24 days) and the later was the Amaralina (48 days).
Rocha et al. (2012) evaluated the performance of soybean genotypes and strains. When it comes to the number of days to maturity cultivar BMS Onyx was the earliest (90.7 days) and the latest was the BCR 1057G157 (114.7 days). Among the 12 genotypes studied by Almeida et al. (2011), the earliest was the BRS/MG 68 (83 days) and the latest was the BRS/MG Garantia (106 days).
Eluzio et al. (2014) mention that there is a correlation between higher plants having smaller height of insertion of the first pod, as well as demonstrate more pods per plant. Besides, when selecting very high plants with low height of insertion of the first pod, losses durng mechanized harvesting may be observed. This fact was noted in the study conducted by the authors, in which all genotypes studied obtained plant height and height of insertion of the first pod suitable for mechanized harvesting.
Among the quantitative characters analyzed in the genetic improvement of soybean, one of the most important is the height of the plant at maturity (Amorim et al., 2011).
Cruz et al. (2010) conducted an experiment to evaluate varieties of several physiological cycles; the variation of juvenility, that is, the period for the plants to reach physiological maturity, was between 40 and 56 days. An average of 121 days between the emergence and maturity of plants was evaluated in soybean genotypes in the experiment conducted by Espíndola et al. (2011).
For Sediyama et al. (1999), tall plants and/or with very thin stems tend to lodging with greater ease, however the genotypes with higher plant height at maturity would be more subjected to lodging. This result was observed only for the genotype Emgopa 314, in Uberaba.
Lodging is an important agronomical trait when selecting soybean genotypes, since the height of the plant and the height of insertion of the first pod may increase losses during the process of mechanized harvesting. So these are characteristics that must be combined with the productivity of grain (Carvalho et al., 2010).
Polyzel et al. (2013) evaluated the agronomic performance of soybean strains in four locations in the State of Minas Gerais (Araguari, São Gotardo, Uberaba and Uberlandia).
Almeida et al. (2011) evaluated twelve soybean genotypes, the overall average grain productivity was 2,656.00 kg ha-1. The most productive cultivar was the BRS/MG Liderança (3,212.00 kg ha-1) and the lowest average productivity was assessed at genotype DM 247: 1,826.00 kg ha-1.
Almeida et al. (2010) evaluated phenotypic, genotypic and environmental correlations among twelve soybean genotypes. The genotype correlations had equal marks and, for the majority of them, higher values were obtained than those for the corresponding correlations. The phenotypic characteristics which indicate a decrease of the influence of the environment to the phenotypic expression were positive and significant between late flowering plants and plants with greater height of insertion of the first pod, and this would allow indirect improvement in grain productivity. According to the Wricke method (Wí%), the more stable genetic material is the one that presents lower estimate for the ecovalence, i.e. the genotype with smaller contribution to interaction genotype × environment (Oliveira, 2003).
Conclusion
The recommendations of the cultivars should be made according to the locality, and the material must present a good combination of characters, taking into account the genotype and environment interaction. The genotypes that showed the greatest production were those with resistance to diseases, showing the importance of the development of genetic materials with this characteristic and its use in genetic improvement programs.
Acknowledgments
The authors of these manuscript acknowledgments the financial support of Fapemig and cnpq.
Conflict of Interest
The authors declare no conflict of interest.
About the Authors
Corresponding Author
C.O. Silva
Mestranda do Programa de Pós-Graduação em Agronomia do Instituto de Ciências Agrárias, Universidade Federal de Uberlândia, Uberlândia, MG, Brasil
- Email:
- caroll_meyreles@hotmail.com
References
- Almeida RD, Peluzio JM, Afferri FS (2010) Correlações fenotípicas, genotípicas e ambientais em soja cultivada sob condições várzea irrigada, Sul do Tocantins. Biosci J 26: 95-99.
- Almeida RD, Peluzio JM, Afférri FS (2011) Divergência genética entre cultivares de soja, sob condições de várzea irrigada, no sul do Estado Tocantins. Rev Cienc Agron. 42:108-115. https://doi.org/10.1590/s1806-66902011000100014
- Amorim FA, Hamawaki OT, Souza LB, Lana RMQ, et al. (2011) Época de semeadura no Potencial produtivo de Soja em Uberlândia-MG. Cienc Agr 32:1792-1802. https://doi.org/10.5433/1679-0359.2011v32suplp1793
- Carvalho ER, Rezende PM, Ogoshi FGA, Botrel EP, et al. (2010) Desempenho de cultivares de soja [Glycine max (L.) Merrill] em cultivo de verão no Sul de Minas Gerais. Cienc e Agrotec 34: 892-899. https://doi.org/10.1590/s1413-70542010000400014
- CONAB (Companhia Nacional de Abastecimento) (2018) Acompanhamento da Safra Brasileira de Grãos, Safra. CONAB, Brasil.
- Cruz CD, Regazzi AJ, Carneiro PCS (2012) Modelos biométricos aplicados ao melhoramento genético Ed. Viçosa, Viçosa.
- Cruz TV, Peixoto CP, Martins MC, Peixoto MFSP (2010) Componentes de produção de soja em diferentes épocas de semeadura no oeste da Bahia. Biosci J 11: 033-042. https://doi.org/10.5380/rsa.v11i1.15941
- Cunha EPC (2003) Desenvolvimento de linhagens de soja de ciclo semiprecoce/médio e semitardio/tardio nas regiões do Triângulo Mineiro e Sul de Goiás. Dissertação de Mestrado, UFU, Uberlândia.
- EMBRAPA (Empresa Brasileira de Pesquisa Agropecuária) (2014) Tecnologias de Produção de Soja: região central do Brasil 2013 e 2014. EMBRAPA, Londrina.
- Espíndola SMCG, Finhildt RS, Ferreira JA, Kitano BT, et al. (2011) Avaliação da performance produtiva e agronômica de genótipos de soja para a região de Jaboticabal, SP. FAZU em Revista 820-824.
- Hirakuri MH, Castro C, Franchini JC, Procópio SO, et al. (2014) Indicadores de sustentabilidade da cadeia produtiva da soja no Brasil. Embrapa, Londrina.
- Juliatti FC, Polizel AC (2004) Manejo integrado de doenças na cultura da soja. 1°. ed. Editora: Composer, Uberlândia.
- Meotti GV, Benin G, Silva RR, Beche E, et al. (2012) Épocas de semeadura e desempenho agronômico de cultivares de soja. Pesqui Agropec Bras.47:14-21. https://doi.org/10.1590/s0100-204x2012000100003
- Oliveira AMS (2003) Estabilidade fenotípica de 28 cultivares de soja em solos sob cerrado no Brasil Central. Dissertação de Mestrado. UFU, Uberlândia.
- Peluzio JM, Lopes LA, Carvalho EV, Afférri FS, et al. (2014) Características agronômicas e divergência genética de cultivares de soja para percentagem de óleo nas sementes. Rev de Cienc Agr 57:1-8. https://doi.org/10.4322/rca.2013.058
- Polizel AC, Hamawaki OT, Juliatti FC (2003) Reação de cultivares de soja quanto à severidade de manchas foliares e a incidência de mosaico comum da soja, em diferentes localidades. In: Congresso Brasileiro de Fitopatologia, Uberlândia.
- Polyzel, AC. Juliatti, FC, Hamawaki OT, Silva EMD (2013) Reação de genótipos de soja de ciclo semiprecoce e médio quanto à severidade de manchas foliares. Biosci J 29: 1231-1242.
- Rocha ES, Silva JAL, Neves JA, Sediyama T, et al. (2012) Desempenho agronômico de variedades e linhagens de soja em condições de baixa latitude em Teresina-PI. Revista Cienc Agron 43:154-162. https://doi.org/10.1590/s1806-66902012000100019
- Santos ER, Barros HB, Ferraz EC, Cella AJS, et al. (2011) Divergência entre genótipos de soja, cultivados em várzea irrigada. Rev Ceres 58:755-764. https://doi.org/10.1590/s0034-737x2011000600012
- Sarriés GA, Olveira JCV, Alves MC (1992) Sanest. Ed Ciagri, Piracicaba.
- Sediyama T, Teixeira RC, Reis MS (1999) Melhoramento da soja. In: Melhoramento de espécies cultivadas (Borém A, ed.). UFV, Viçosa, 487-534.
- Sediyama T, Pereira MG, Sediyama CS, Gomes JLL (1996) Cultura da soja, I parte. UFV, Viçosa.
- Tsumanuma GM. Soares AR, Fancelli AL, Rodrigues MAT, et al. (2010) Efeito de herbicidas e fungicidas nas curvas de progresso e quantificação de danos causados pela ferrugem asiática da soja. Cienc Rural. 40: 1485-1491. https://doi.org/10.1590/s0103-84782010005000123
- Wricke G (1965) Zur Berechunung der Okovalenz bei Sommerweizen und Hafer. Z pflanzenzuchtung. 52: 127-138.
Keywords:
Download:
Full PDF- Share This