Comparative analysis of genomic DNA extraction protocols: Maxi-preparation of quality DNA for genetic evaluation and phylogenetic studies
Received: November 30, 2019
Accepted: February 13, 2020
Published: February 19, 2020
Genet.Mol.Res. 19(1):
Keywords
Freshwater; Fish species; DNA isolation; Protocol comparison; DNA quantification
Introduction
DNA extraction remains as an important issue in molecular biology (Pandey RN et al., 1996). DNA extraction is basic step in many biological studies including identification, inference of genes, genetics and genomic as molecular base study; also have importance in medical examinations, clinical diagnosis and investigations. So, multiple methods were shaped to isolate DNA for biological means (Milligan BG, 1998). Despite of that various methods have diverse effect on extraction of DNA (Waldschmidt AM et al., 1997; Chen M, 2008). Foremost step necessary for ideal DNA extraction protocol are: Optimal DNA extraction protocol, reduction in degradation of DNA, cost effective and useful in terms of labour and time (Chen H et al., 2010). Addition to that DNA extraction protocols should not use toxic chemicals or produce hazardous wastes (Dittrich-Schroder G et al., 2012). Even though purpose of DNA extraction is to purify DNA by binding or splitting it (Hajibabaei M et al., 2005), the simplified DNA extraction protocol, such as the protocol that uses a commercial group, is more cost-effective and allows hundreds of thousands of samples encoded in the same facility each year (Wong EHK, 2008).
Materials and Methods
Fish samples
Samples of freshwater species of fish (Hypophthalmichthys molitrix, Labeo rohita and Sperata sarwari) were collected from Chenab River, Multan, Pakistan. All specimens were identified on morphological basis by using taxonomic key based on visible characteristics as length, weight, various fin ray counts and so. Samples were stored in laboratory for freezing at –20°C further analysis.
Tissue preparation
Tissues of various regions like Caudal, Pectoral, Pelvic, Gill and Muscle were used for DNA extraction.
DNA extraction
Four different extraction methods for Genomic DNA were used and conducted in triplicate analyses for each sample.
Method I: Modified phenol chloroform extraction protocol
50–100 mg of each tissue with 600-800 μl extraction buffers was used for grinding and immediately transferred into MCT. Add 12 μl Proteinase K, vortex it and were incubated at 37 and 55° C for 1 hour respectively, Centrifuged at 5000rpm for 10 minutes. Then supernatant was collected in new MCT, add equal volume of phenol: chloroform: isoamyl alcohol (25:24:1) in it, mix it by repeated MCT inversion and centrifuge it at 12000rpm for 10 minutes. Supernatant was then collected and add equal volume of chloroform: isoamyl alcohol (24:1) in it, again repeat the process of inversion on centrifugation at 12000 rpm for 10 minutes, collect supernatant, add 0.1 volume of 3 Molar sodium acetate and 100% ethanol in equal volume. MCT were placed at -20°C for 1-2 hour and centrifuged again at 4000 rpm for 4 min. Wash DNA pellets with 70% ethanol, keep it for air dry and suspend adequate volume of triple distilled water (AquaPro Injection, Pakistan) and stored at -20°C until further processing.
Method II: High salt protocol
Tissue of ~0.5 cm2 was used for analysis, sample were cut with a sterile blade. The samples was transferred to a labelled 1.5 ml MCT and add 600 μl of buffer (TNES) with 35 μl of Proteinase K. Mixing of samples were done by the repeating inversion of tubes and then incubated it for overnight at 50ºC. After incubation add 166.7 μl of 6 Molar Nacl, shaken it vigorously for few seconds and centrifuge it at 14,000rpm for 10 minutes. Supernatant was taken to newly labelled MCT and add equal volume of 100% cold ethanol, gently mixed by repeated inversion of tube.
Centrifugation was again done at 14,000 rpm for 15 minutes at 4ºC. Remove the Supernatant carefully due course for prevention in DNA pellet disruption. Pellet was washed in using 500 μl of pure and 70% ethanol simultaneously. After removing that sample were centrifuges to get the last of ethanol in bottom of tube; remove out the remaining ethanol. Sample was left to air dry for 30 minutes. As soon as the sample was just dry, re-the DNA was suspended in about 100 μl sterile distilled water.
Method III: TNES Extraction protocol
Tissue of sample were taken 20 mg, add 800 μl buffer solution and 10 μl of RNase. Homogenized it and kept it for incubation at 42°C for 1 hour. Also added 10 μl of Proteinase K and kept it at 42°C for overnight incubation. 800 μl of Phenol: Chloroform: Isoamyl Alcohol (25:24:1) was added to new MCT, mix it by repeated inversion. Sample was then centrifuged for 15 min at 10,000 rpm and then recovered top aqueous layer. DNA was precipitated in one volume of 1 Molar Nacl and two volumes of ethanol. The DNA becomes washed with ethanol 70%; kept it for air dry and resuspended it in 60 μl of doubled distilled water.
Method IV: Urea extraction protocol
Tissue become dry by using filter paper and placed it in 2 ml of lysis buffer in falcon tube. Added RNase with volume of 30 μl and incubated it at 42°C for 1 hour. After that 30 μl of Proteinase K was added, mixed it by repeated inversion and kept it at 42°C for 10 hours. Equal amount of Phenol: Chlorophorm: Isoamyl Alcohol (25:24:1) was added in MCT, mixed it by repeated inversion of tube, and become centrifuged for 15 minutes at 13,000 rpm and recovered the top aqueous layer. 1 M NaCl and 2-3 volumes of chilled ethanol were added in the tube. Sample was kept at -20°C for 2hours and centrifuged it at 13000 rpm for 15 minutes. DNA pallets were washed with 70% ethanol, become air dried and resuspended in appropriate volume of distilled water and stored at -20°C for further analysis.
Statistical analysis
For DNA concentrations were used for comparison from studied fish with the different DNA methods of DNA extraction. ANOVA was performed by using SPSS. ANOVA was also utilized in order to compare the DNA purities from three different fish species. Differences were considered statistically significant at P<0.05. Tukey’s, fisher and Dannett’s multiple comparison procedure was used when interactions were significant in order to interpret which interaction effects differed. Graphical representations were performed using R software.
Results
DNA concentration and its purity obtained from the Labeo rohita, Hypophthalmichthys molitrix and uSperata sarwari sing four different methods of extraction. Statistical study employ purity and yield may differ significantly by analysing significant interaction existed among various methods of DNA extraction. Various DNA extraction methods were performed accordingly; the Phenol chloroform method consistently extracted highest purity and yield of quality DNA as compare to other methods. It is also pin pointed that PC method also required more tissue (50-100 mg) of sample for extraction of DNA than other methods.
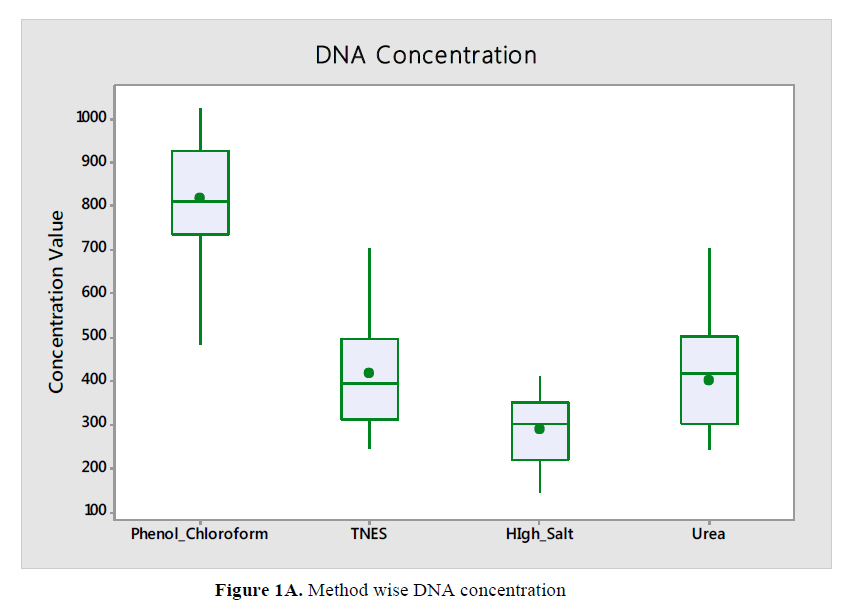
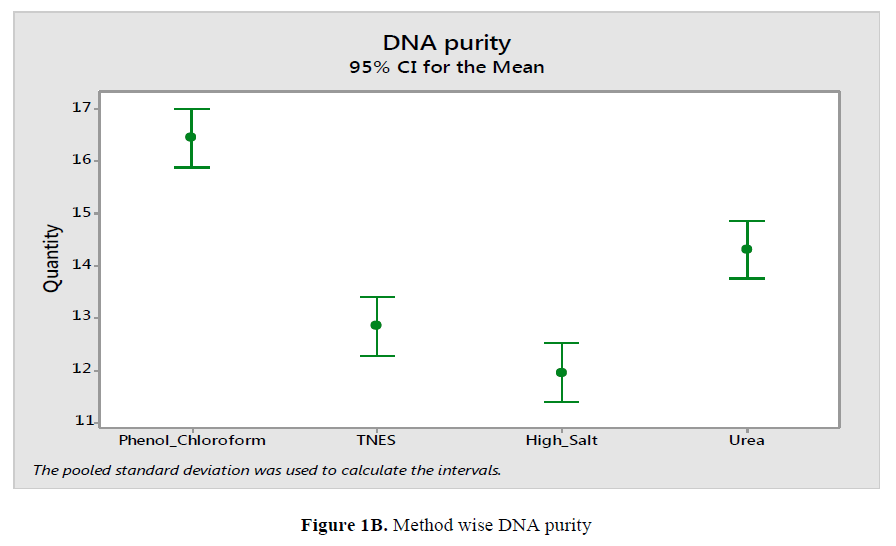
For the Hypophthalmichthys molitrix, Labeo rohita and Sperata sarwari, DNA yield and concentration obtained with the Phenol Chloroform extraction method found significantly higher than obtained with other method like High Salt, Urea and TNES respectively as in Figure 1A and Figure 1B. Same trend were found in all the fish species.
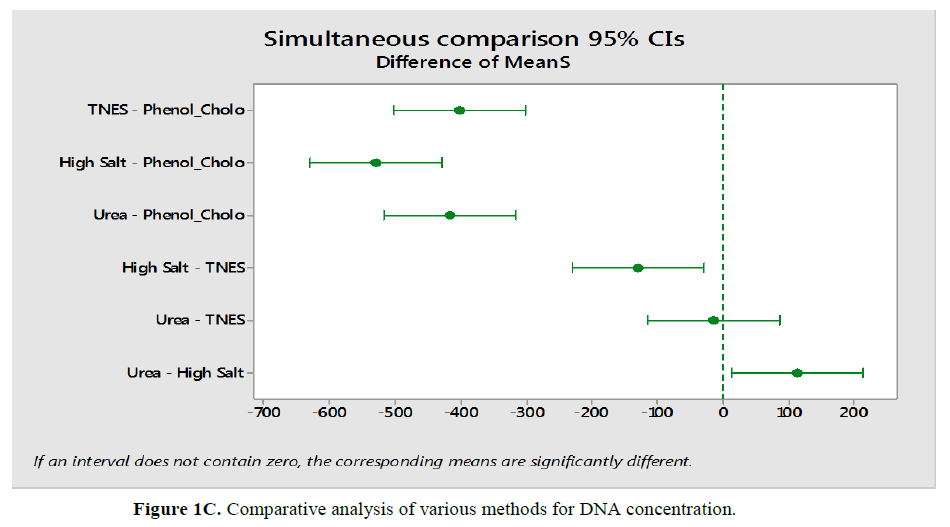
Comparison of Hypophthalmichthys molitrix, Labeo rohita and Sperata sarwari as per method respectively as according to concentration and yield of DNA shown in Table 1 and Table 2 and Figure 1C and Figure 1D. DNA concentration were found significant correlation (P<0.05) comparatively in TNES-Phenolchloroform; High Salt - Phenol chloroform; Urea-Phenol chloroform High Salt-TNES and Urea-high salt. While shows a non-significant correlation (P>0.05) in Urea-TNES, meant that in case of Urea-TNES it doesn’t matter who is been selected for extraction both shows same results (Figure 1C). Same trend were found in all fishes.
| Analysis of Variance |
|---|
| Source DF Adj SS Adj MS F-Value P-Value |
| Factor 3 3078273 1026091 73.73 0.000 |
| Error 72 1002057 13917 |
| Total 75 4080330 |
| Means |
| Factor N Mean StDev 95% CI |
| Phenol_Choloform 19 819.1 130.2 (765.2, 873.1) |
| TNES 19 417.3 124.8 (363.4, 471.3) |
| High Salt 19 287.9 82.8 (234.0, 341.9) |
| Urea 19 401.2 127.6 (347.2, 455.1) |
| Grouping Information of DNA concentration |
| Factor N Mean Grouping |
| Phenol_Choloform 19 819.1 A |
| TNES 19 417.3 B |
| Urea 19 401.2 B |
| High Salt 19 287.9 C |
Table 1: Analysis of Variance. Means and Grouping Information of DNA concentration
| Analysis of variance | |||||
|---|---|---|---|---|---|
| Source | DF | Adj SS | Adj MS | F-Value | P-Value |
| Factor | 3 | 2.203 | 0.73438 | 48.98 | 0.000 |
| Error | 72 | 1.08 | 0.01499 | ||
| Total | 75 | 3.283 | |||
| Means | |||||
| Factor | N | Mean | StDev | 95% CI | |
| Phenol_chloroform | 19 | 1.6453 | 0.1006 | (1.5893, 1.7013) | |
| TNES Method | 19 | 1.2842 | 0.1366 | (1.2282, 1.3402) | |
| High Salt | 19 | 1.1953 | 0.0911 | (1.1393, 1.2513) | |
| Urea Method | 19 | 19 | 1.4311 | (1.3751,1.4871) | |
| Grouping information of DNA purity | |||||
| Factor | N | Mean | |||
| Phenol_chloroform | 19 | 1.6453 A | |||
| TNES Method | 19 | 1.4311 B | |||
| High Salt | 19 | 1.2842 C | |||
| Urea Method | 19 | 1.1953 D | |||
Table 2: Analysis of variance. Means and grouping information of DNA purity.
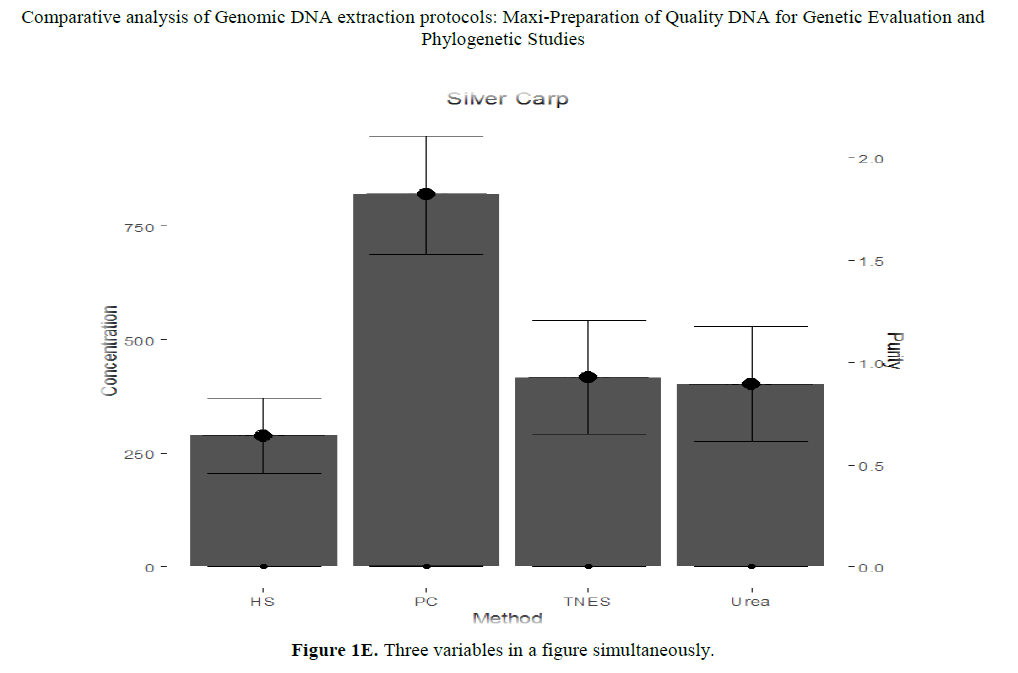
DNA concentration shows a significant correlation (P<0.05) as compare to TNES-phenol-chloroform; High salt-phenolchloroform; Urea-phenol chloroform; Urea-TNES and urea-high salt. While shows a non-significant correlation (P>0.05) in High salt-TNES, meant that in case of High Salt-TNES it doesn’t matter who is been selected for extraction both shows same results (Figure 1C). Also draw three variables in Figure 1E.
Discussion
It is obvious that when DNA extraction methods were used, a significant difference in yield and concentration of DNA in species were found. Thus, it seems liable that the composition or nature of tissue in different species had an effect on ability of extracted DNA with some method were being more suitable than others. Studied reported earlier that the lower quantity of DNA extraction can be allied with samples with higher contents of fats (Saunders GC., et al. 2001), even though this was not apparent in present study.
Of three DNA extraction methods using 50 to 100 mg sample the phenol chloroform method found significant with higher yields than others while lowest yields were from tissues with High Salt method. Method suitability for the DNA extraction from muscle tissue would subsequently depends upon either the user entail consistently bring similar yield or method deliver higher DNA yield is mandatory. Mean yield of DNA attain from muscle tissue was well supported in the literature as compare to the other.
DNA purities from various fish species by using different extraction method were estimated by A260/A280 ratio. By Statistical analysis a significant differences among the various species by using various method of extraction were resolute. DNA was found satisfactory when A260/A280 ratio were remained from 1.6 to 2. (Rapley R, 1996; Aljanabi SM, 1997; Lopera-Barrero, 2008; Ferrara GB, 2006; Sambrook J, 2001). Reduction in value of A260/A280 were marked contaminated DNA with impurities in it. Remaining impurities from DNA extraction process were from chloroform, ethanol or phenol, were reported by absorption A260/A280 ratio (Mackie IM, 1998; Wilfinger WW et al., 2006). DNA extracted with Phenol Chloroform method was found considerably higher than others. Absorbance values can’t be distinguished, an accurate quantification of DNA is thus dependent upon the DN with their high purity (Wasko AP, 2003).
Polymerase Chain Reaction was used to assess the suitability and quality of DNA. Despite of yield and purity ranges noted for the DNA extraction by using different method; all four methods quantify DNA successfully and also amplify through Polymerase Chain Reaction. However, when DNA extracted with these methods, the PCR was optimized using 3 ml of quality DNA in reaction mixture. Polymerase Chain Reaction are concentration dependent it may inhibited by high or low concentration (Nazar AZ, 2019). The concentration, purities and yields of extracted DNA from species standardised method were presented. Present results suggest that Phenol Chloroform protocol is able to delivering high DNA yields than others protocols.
Conclusion
To be the best of our knowledge, present study was used to compare the efficiency of various method of DNA extraction from fish tissues. Present result marked variability in yield, purity of different DNA extraction method for quality DNA. DNA of a high yield and purity is important for molecular techniques success, as Polymerase Chain Reaction and further sequencing of DNA. Present study marked that Phenol Chloroform extraction method as most appropriate extraction method for quality DNA, due to their high yield of DNA deliver relatively safe method, ease for use and applicable for high throughput for various specimens.
About the Authors
Corresponding Author
Muhammad Naeem
Institute of Pure and Applied Biology, Bahauddin Zakariya University, Multan, Pakistan
- Email:
- dr_naeembzu@yahoo.com / saim1692@gmail.com
Qurban Ali
Institute of Molecular Biology and Biotechnology, University of Lahore, Lahore, Pakistan
- Email:
- skndrhayat93@gmail.com / saim1692@gmail.com
References
- Pandey RN, Adams RP, Flournoy LE (1996). Inhibition of random amplified polymorphic DNAs (RAPDs) by plant polysaccharides. Mol Bio Reproduction 14: 17-22. https://doi.org/10.1007/bf02671898
- Milligan BG (1998). Total DNA isolation. In: Hoelzel AR, editor. Oxford. New York: Tokyo: Oxford University Press. Molecular Genetic Analysis of Population: A Practical Approach, 2nd Edition, 29-64.
- Waldschmidt AM (1997). Extraction of genomic DNA from Melipona quadrifasciata(Hymenoptera: Apidae, Meliponinae). Brazilian J Genetics 20: 421-423. https://doi.org/10.1590/s0100-84551997000300011
- Chen M, Zhu Y, Tao J, Luo Y (2008). Methodological comparison of DNA extraction from Holcocerrushippophaecolus (Lepidoptera: Cossidae) for AFLP analysis. For Study China 10: 189-192. https://doi.org/10.1007/s11632-008-0035-5
- Chen H, Rangasamy M, Tan SY, Wang H, et al. (2010). Evaluation of five methods for total DNA extraction from western corn rootworm beetles. PLoS One 5: 11963. https://doi.org/10.1371/journal.pone.0011963
- Dittrich-Schroder G, Wingfield MJ, Klein H, Slippers H (2012). DNA extraction techniques for DNA barcoding of minute gall-inhabiting wasps. Mol Eco Res 12: 109-115. https://doi.org/10.1111/j.1755-0998.2011.03074.x
- Hajibabaei M, Ivanova NV, Ratnasingham S, Dooh RT, et al. (2005). Critical factors for assembling a high volume of DNA barcodes. Philosophical Transactions of the Royal Soc B: Biological Sci 360: 1959-1967. https://doi.org/10.1098/rstb.2005.1727
- Wong EHK (2008). Hanner, R.H., DNA barcoding detects market substitution in North American seafood. Food Res Intl 41: 828-837. https://doi.org/10.1016/j.foodres.2008.07.005
- Saunders GC and Rossi JM (2001). DNA extraction. In J. T. K., L. Birch (Eds.) Essentials of nucleic acid analysis: A robust approach. Great Britain: Royal Soc Chem.
- Rapley R (1996). Molecular analysis and amplification techniques. In JM Walker & R Rapley (Eds.). Mol Biology and Biotech 25-66. https://doi.org/10.1039/9781847551498-00025
- Aljanabi SM and Martinez I (1997). Universal and rapid salt-extraction of high quality genomic DNA for PCR-based techniques. Nucleic Acids Res 25: 4692-4693. https://doi.org/10.1093/nar/25.22.4692
- http://rcia.uc.cl/index.php/ijanr/article/view/374
- Ferrara GB, Murgia B, Parodi AM, Valisano L, et al. (2006). The assessment of DNA from marine organisms via a modified salting-out protocol. Cell and Mol Biology Letters 11. https://doi.org/10.2478/s11658-006-0013-7
- Sambrook J and Russel DW (2001). Molecular cloning: A laboratory manual (3rd edn). New York: Cold Spring Harbor Laboratory Press, USA.
- https://doi.org/10.1007/978-1-4613-1119-5_5
- Wilfinger WW, Mackey K, Chomczynski P (2006). In: DNA sequencing II optimizing preparation and cleanup. Sudbury KJ, editor. MA: Jones and Bartlett Publishers. Assessing the quantity, purity and integrity of RNA and DNA following nucleic acid purification 291-312.
- Wasko AP, Martins C, Oliveira C, Foresti F (2003). Non-destructive genetic sampling in fish. An improved method for DNA extraction from fi sh fins and scales. Hereditas 138: 161-165. https://doi.org/10.1034/j.1601-5223.2003.01503.x
- Nazar AZ, Ali Khan HMW, Ali Q, Nasir IA (2019). Identification of novel QTLs controlling sugarcane smut resistance and yield traits. Genetika 51: 877-894. https://doi.org/10.2298/gensr1903877n
Keywords:
Download:
Full PDF- Share This


