Detection of HER2 gene amplification in formalin-fixed and paraffin-embedded breast cancer tissues by quantitative real time polymerase chain reaction in ER and PR-positive HER2 immunohistochemistry 0 or ≥ 2+ breast cancer
Received: July 29, 2024
Accepted: August 01, 2024
Published: December 25, 2024
Genet.Mol.Res. 23(4):
Keywords
HER2 gene; Amplification; Formalin-Fixed Paraffin Embedded (FFPE); Breast cancer; Polymerase chain reaction
Introduction
The human epidermal growth factor receptor 2 gene (HER2, also known as erbB2) has been regarded as a critical factor for diagnosis and effective treatment of breast cancer patients [1]. The gene encoding HER2 protein is located on chromosome 17. Amplification of the HER2 gene and overexpression of its gene product, the HER2 protein was found in 20% of breast cancers [2,3]. The signaling pathways of the Estrogen Receptor (ER) and the HER2 are the dominant drivers of cell proliferation and survival in the majority of breast cancers [1,4]. Genetic in-stability, and hence aberrant HER2 amplification may be associated with breast cancer progression [5].
Progesterone Receptors (PR), (ER) and HER2 are the most routinely used basic, prime molecular markers for detection of breast cancer worldwide. These markers provide the suitable prediction of the prognosis of cancer recurrence after an initial remedial treatment. These three markers indicate eventual future appropriate treatment; and thus, they play a key role in the management of breast cancer. Molecular techniques can be implemented to detect ER, PR and HER2 levels. The RT-PCR technique can detect low concentrations of ER/PR/HER2 mRNA. If the molecular techniques such as RT-PCR and qPCR are utilised in the routine diagnosis of best cancer a new breast cancer scoring system based on these newer expeditious technologies will be established, then grading and management of breast cancer will be easier, enhanced, and quicker. Hormone receptors and HER2 as molecular markers are of prime therapeutic importance and have the capability to take part in future drug development techniques [6].
Amplification and/or over expression of the HER2 oncogene is found in many different types of human cancers, including breast, ovarian, lung, gastric and oral cancers. It is the second member of the epidermal growth factor receptor family. A correlation was found between the degree of gene amplification and aggressive potential of the tumour and its proliferative activity. It was found that amplifications and deletions are the most common mechanisms leading to gene deregulation [7].
HER2 gene amplification was found in Estrogen Receptor (ER)-positive, HER2 Immuno-Histo-Chemistry (IHC) 0 or 1+ breast cancer in patients who developed early distant metastasis [8]. This indicates that HER2 gene amplification detection can play an important role in the prognosis of the disease and the design of treatments plans. An association between HER2 amplification and poor prognosis was found to be attributed to global genomic instability. This is due to the association that exists between cells with high frequencies of chromosomal alteration and increased cellular proliferation and aggressive behaviour [9]. Tumor grade and/or Ki67 expression are predictors of early recurrence in ER-positive, HER2-nagative breast cancer [10-12]. Endocrine therapy is the most important treatment option for women with ER-positive breast cancer [13]. The clinical significance in breast cancer for HER2 gene amplification in HER2 scores 0 or 1+, with no gene overexpression, was identified. In addition, some patients with HER2-IHC 0 or 1+ primary tumors develop early relapse with HER2-positive metastasis, which might be due to the existence of HER2 gene amplification in the primary tumors [8]. Moreover, HER2 mRNA detection could potentially serve as a quantitative and reliable method for identifying HER2-low breast cancer [14].
HER2 status determination plays an important role in selecting the best treatment options in early and advanced breast cancer [15,16]. The qPCR technique is based on the detection of DNA amplification. Accordingly, using a quantitative method such as qPCR will be complementary to IHC and FISH in determining HER2 status in breast cancer patients and give them a better treatment opportunity. The sensitivity of the real-time PCR (RT-PCR) technique can provide the information related to small alterations such as point mutation, gene expression, gene loss or amplification and the analysis of cancer markers. Accordingly, RT-PCR plays an important role in clinical testing [17]. The implementation of molecular classifications for malignancies provides powerful tools for diagnosing and treating cancer. HER2 gene quantification could benefit cancer patients if they will make them eligible for HER2 targeted medications.
In this study qPCR was used to detect the losses or amplifications if any are found in the HER2 gene in 44 FFPE breast cancer tissue samples with IHC 0 or ≥2+, and were ER and PR positive. Real time PCR is used for sensitive detection and quantification of the gene fold levels [19]. Breast cancer in Kuwait contributes for 49.4% from all types of cancers that were reported at Kuwait cancer registry for all adults. Kuwaiti breast cancer patient’s ages were 15-99 years [20]. Across the Gulf cooperation countries, the GCC breast cancer stands as the prevailing malignancy [21]. In the GCC geographic region, there are distinctive features that the breast cancer manifests with, including an early onset, typically occurring before the age of 50, an advanced stage at presentation, and a higher pathological grade. In addition, in the GCC region more aggressive features such as HER2 positivity, or the presence of Triple-Negative (TN) attributes were observed, particularly among younger patients [20].
Materials and Methods
In this study Forty-four 44 FFPE breast cancer tissue samples from Royal Hayat hospital in Kuwait were studies. For all patients’ tissues, IHC was performed to verify the expression of HER2. IHC test for the HER2 protein over expression was performed using HercepTestTM kit (Dako). The IHC test for HER2 protein was performed and validated at Royal Hayat hospital. DNA isolation from FFPE samples was performed using the NucleoSpin®DNA FFPE XS kit. According to the histopathology reports obtained from Royal Hayat hospital, 8 samples were grade I, 21 samples were grade II and 15 samples were grade III. The grading was made using the tumour size, Lymph Node involvement and Metastasis (TNM) grading system.
Quantitation of the HER2 gene was done by real time PCR. Samples with no DNA and with normal DNA were included. The primes used for the HER2 gene were as follows: Forward primer for HER2 gene, 5’-AGCCTCTGCATTTAGGGATTCTC, reverse primer for the HER2 gene, 5’-TAGCGCCGGGACGC, and the probe used was 6FAM5’-TGAGAACGGCTGCAGGCAACCC-3’TAMRA.1 For the quantitation of the β actin gene the following forward and reverse primer sequences were used respectively: ACTCCTATGTGGGCAACGAG, and AGGTGTGGTGCCAGATCTTC [22].
For real time PCR TaqMan™ fast advanced master mix (Applied bio-systems, Thermo Fisher Scientific Baltics UAB) was used. The beta actin gene was used as a reference gene to the HER2 gene investigated. The 7500 fast real-time PCR system (Applied bio-systems) was used. Amplification conditions were 50ºC for 2 min, 95ºC for 10 min, 40 PCR cycles at 95 ºC for 15 s, and 60ºC for 1 min.
The qPCR for the HER2 gene was set up in 96-well plates, in a final volume of 20 μL containing of up to 1 μL of isolated DNA, 10 μL of TaqMan™ gene expression master mix, 1 μL of forward gene primer, 1 μL of reverse gene primer, 0.5 μL of HER2 gene probe, and 6.5 μL of molecular water. For the β actin gene qPCR reaction the following mixture was used: 1 μL of isolated DNA, 10 μL of PowerUpTM SYBR®Green Master Mix (appliedbiosystems Thermo Fisher Scientific Baltics UAB), 1 μL of forward gene primer, 1 μL of reverse gene primer and 8 μL of free molecular water.
Calculation of the relative fold values of the HER2 gene
Averages for the Ct values were calculated for the HER2 gene. The HER2 gene was normalized with β actin gene. The ΔCt value which is the difference between the average of the Ct value of the target and the Ct value of the reference gene was calculated. Then the ΔΔCt value was calculated by subtracting the ΔCt value of the samples from that ΔCt value of the control which was the normal DNA sample. Then the 2^ΔΔCt value was determined. Finally, the relative fold change of the target gene in relation to the control sample was determined by dividing the sample 2^ΔΔCt value by that of the control normal DNA.
Converting the Ct values to a linear form using the 2^ΔΔCt value more accurately depicts the individual variation among replicate reactions [23].
Statistical analysis
A One-Way Analysis of Variance (ANOVA) test was used to analyse the data taken from the breast cancer samples to determine whether the three groups of patients; grade I, II and III HER2 qPCR relative values are statistically different by calculating the means of the three groups. Then the means of the three patients’ groups were tested for their difference from the mean of the dependent variable. The one way-ANOVA test will show if the dependent variable changes according to the level of the independent variable [23]. The breast cancer is considered as the independent variable. The qPCR values in the three groups were considered as the dependent variables. The null (H0) hypothesis of the one way-ANOVA is that there is no difference among group means. The alternative hypothesis is that one group differs significantly from the overall mean of the dependent variable. One way-ANOVA test was applied to the data using Microsoft Excel. The significance threshold in the analysis was .05. The P value was interpreted to be significant if it is ≤ 0.05.
Results
The qPCR values for the HER2 gene were obtained. The Ct values for each breast tumor sample were normalized with β actin gene Ct values. The results were compared with normal DNA sample and the 1 fold change was obtained for normal sample. The fold change that is above 1 was considered an up-regulation and the fold change below 1 was considered a down-regulation. Regarding the HER2 protein status of the samples determined by IHC; 32 samples were negative for HER2, 6 samples were equivocal, and 6 were positive.
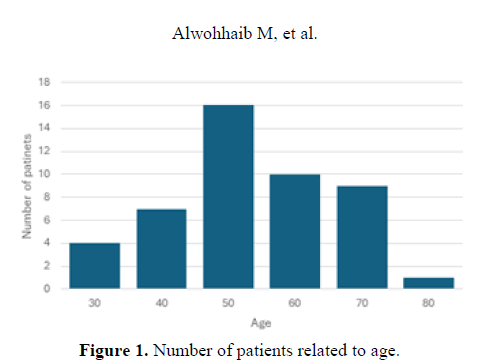
The ages of the patients where the samples were investigated were 30-80 years. The highest number of patients was in the 50 years old group (Figure 1).
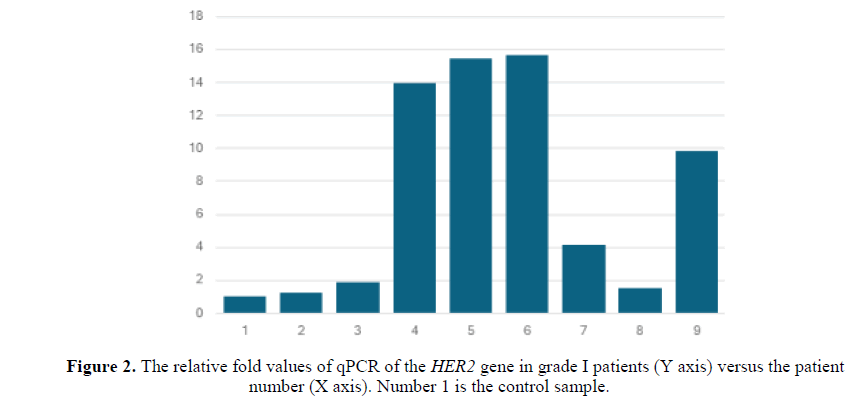
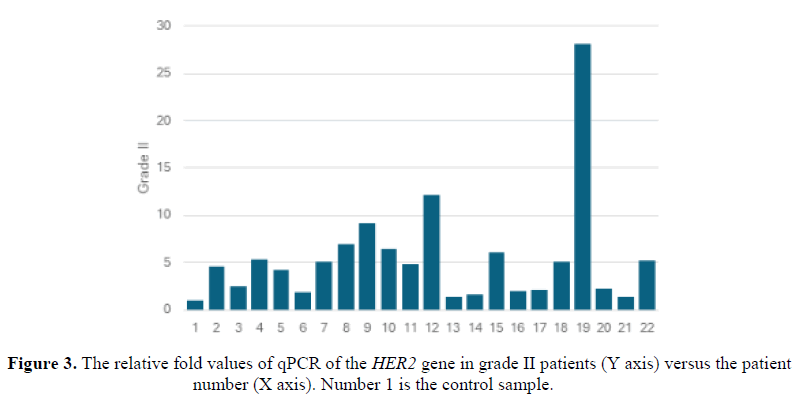
All the samples showed abnormal qPCR relative values compared to the normal. The relative fold values of qPCR of the HER2 gene in grade I patients were all abnormally elevated compared to the normal sample (Figure 2). Similarly, the relative fold values of qPCR of the HER2 gene in grade II patients were abnormally up-regulated (Figure 3).
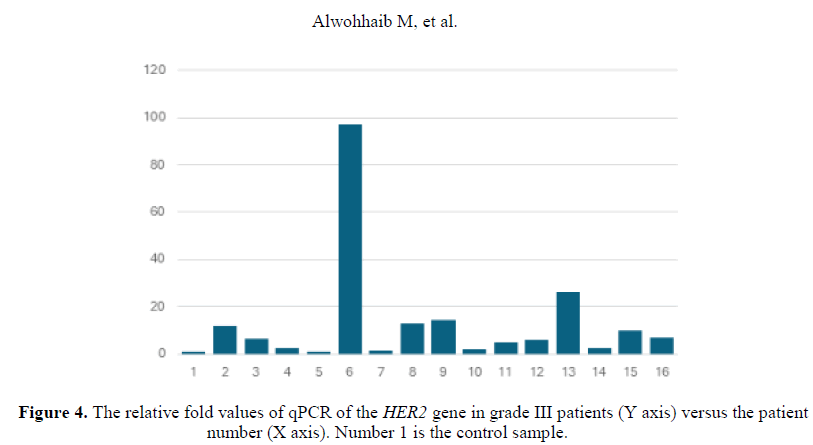
One sample in the grade III group was down-regulated concerning the HER2 qPCR relative value while all the remining samples showed variable degrees of up-regulation (Figure 4).
With a P-value of .251138 for the one way-ANOVA test (Table 1), there is no significant association between the grade of the breast cancer tumor and the qPCR relative values. On the other hand, an amplified qPCR value for the HER2 gene was observed in nearly all the samples, including the HER2 negative samples. The HER2 negative samples were the majority.
| Table 1. ANOVA: Single factor results. | ||||||
| Summary | ||||||
| Groups | Count | Sum | Average | Variance | ||
|---|---|---|---|---|---|---|
| Column 1 | 8 | 52.84328 | 6.605409 | 34.5265 | ||
| Column 2 | 21 | 118.3349 | 5.634996 | 34.1284 | ||
| Column 3 | 15 | 207.42 | 13.828 | 575.6986 | ||
| ANOVA | ||||||
| Source of variation | SS | df | MS | F | P-value | F crit |
| Between groups | 626.4219 | 2 | 313.211 | 1.429386 | 0.251138 | 3.225684 |
| Within groups | 8984.033 | 41 | 219.1228 | |||
| Total | 9610.455 | 43 | ||||
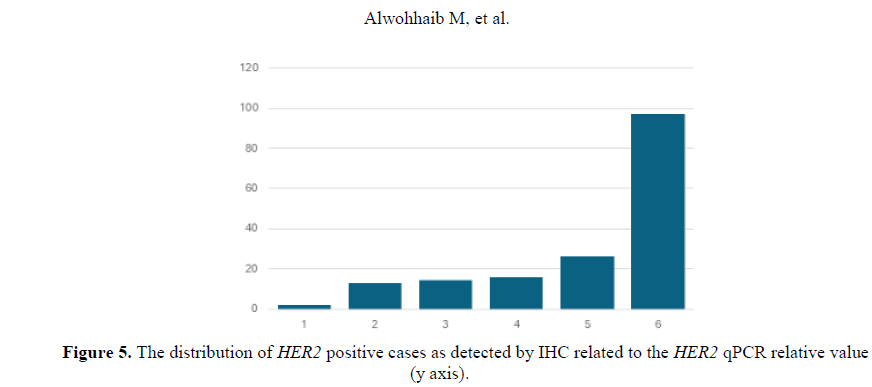
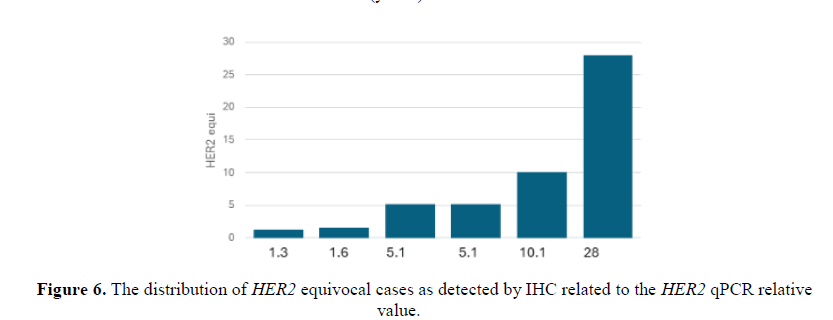
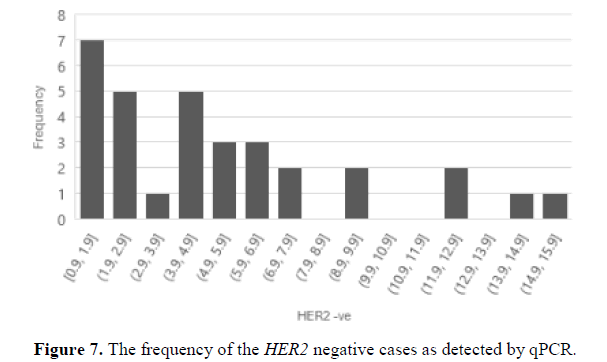
From the 44 archival samples previously evaluated by IHC the qPCR results showed variable relative values. Samples reported as HER2 positive (3+) (Figure 5), presented high relative values. Two samples qPCR relative values were 15 and the others were 26, 97, 13. The sample with the 97 qPCR relative value was from a grade III patient. On the other hand, one HER2 positive (3+) evaluated sample presented a qPCR value=2 which was taken from a grade I patient. Samples evaluated as HER2 equivocal and were negative by FISH presented high qPCR values of 10 and 28 (Figure 6). The sample that presented a qPCR value=28 was from a grade 3 patient. On the contrary, one HER2 equivocal sample by IHC and positive by FISH presented a qPCR value of 16 which was from a grade I patient. Seven samples were evaluated as HER2 negative by IHC (Figure 7) presented high qPCR values, being 2 samples with a relative value of 9, two other samples yielded a relative qPCR value =12, and 2, others gave a relative value =15, and 1 sample with qPCR value=13. Samples with an evaluation of HER2 negative by IHC and high qPCR relative values were from grades I and II patients.
Discussion
The samples investigated in this study were all from higher pathological grade and more aggressive features such as HER2 positivity. Which was noticed in the GCC countries [20]. This study was performed to investigate HER2 gene quantity by using real-time PCR in grades I, II and III breast cancer archival tissue which were previously categorized by IHC into HER2 negative, HER2 equivocal and HER2 positive (3+). The relative fold values obtained in this study were elevated in most of the samples with no significant association with the grade of the tumor. The molecular biology screening for the HER2 gene is essential. Some patients who showed a negative HER2 status by IHC, presented high qPCR values. In addition, HER2 equivocal samples which were negative by FISH presented an elevated qPCR relative value. Notably the sample with an equivocal evaluation by IHC and -ve HER2 status by FISH which belonged to a grade III patient. Quantitative reverse transcriptase real time PCR (qRT-PCR) may outperform FISH in identifying patients overexpressing HER2 protein [24]. FISH analysis depends on the HER2 positive cells observed with respect to the amount of tissue analysed. Quantitative PCR analysis in this sense, avoids the possible misinterpretation by sensitive measurement of the gene quantity ratio that is independent from tissue amount. Accordingly, molecular techniques such as RT-qPCR might be added to the methods for screening HER2 status in breast cancer patients.
Many laboratories have adopted IHC, as a screening method, and FISH as a conformation test for HER2 equivocal cases, taking into consideration higher failure rate, longer procedure time and higher reagent cost of FISH, compared to that of IHC. Nevertheless, the IHC and FISH might not be as sensitive as qPCR especially in the higher grades of breast cancer who might get more accurate evaluation and might benefit from better treatment options. False negative or positive HER2 evaluations may result in inappropriate treatment administration. Regarding the samples that were evaluated negative for HER2 by IHC and presented elevated qPCR relative values, further assessment would be recommended. The differences between HER2 2+ or equivocal by IHC with respect to FISH and qPCR were previously reported [24,25]. There are factors such as tissue quality, fixation time and type of antibody used that might contribute to the variability in the results obtained for HER2 2+ by IHC [26,27]. Furthermore, considerations must be taken to the alterations of HER2 status which might occur after neo-adjuvant chemotherapy or during metastatic progression, due to biologic or methodologic issues [28]. Studies have shown that HER2 amplification-positive patients had a higher mutation frequency than the HER2 amplification negative patients [29]. Another important factor in the determination of the HER2 status would be the screening for the gene mutation. Hence, HER2- mutated non-amplified breast cancer may benefit from pyrotinib treatment as well.
Some researchers have suggested that qPCR cut-off should be greater than 2.7 to be considered as HER2 amplification [30,31,26]. In our study 12 samples out of 32 in the HER2 negative group showed lower relative qPCR fold values (≤ 2.3). On the other hand, 20 samples out of 32 at the HER2 negative group showed high qPCR values (>3.6). These results necessitate the revaluation of the HER2 testing methods at the hospital and adopting supporting tests such as molecular quantification methods. A study found out that a better correlation of clinicopathologic features and oncotype DX recurrence score was found between ER-positive, HER2-negative breast cancers by quantifying HER2 mRNA levels than HER2 IHC [14]. Thus, introducing molecular techniques such as qPCR in the routine evaluation for HER2 status will support accurate quantification and interpretation.
In this study at the HER2 equivocal group, 2 out of 6 cases analysed showed low qPCR relative value (≤1.6) and 4 presented higher values (5.1-28). These samples were negative by FISH. A study showed that qRT-PCR may outperform FISH in identifying patients overexpressing HER2 protein, suggesting that qRT-PCR might be more accurate than qPCR and FISH [32]. Measuring the protein level is quite crucial together with that of the gene level. DNA copy number amplifications are one of the most important mechanisms leading to deregulated gene expression in cancer [15]. In this study, among the HER2 positive group by IHC one case presented a qPCR relative value equal to 2.2 and 5 presented higher values (3.1-97). The two highest qPCR values in the HER2 positive group were a grade three patients.
Conclusion
As observed in the amplified qPCR values of the cases that were negative in HER2 protein status by IHC or FISH, a molecular technique such as qPCR or RT-qPCR might be added to the methods for screening HER2 status in breast cancer patients. The routinely used methods in breast cancer evaluation IHC and FISH might not be as sensitive as qPCR especially in the higher grades of breast cancer who might get more accurate evaluation and might benefit from better treatment options. Inaccurate HER2 evaluations may result in inappropriate treatment administration. Future studies that involve the screening for HER2 mutations alongside the conformational evaluation by qPCR in HER2 negative compared to HER2 positive are important. Finally, hormone receptors and HER2 as molecular markers are of prime therapeutic importance and have the capability to take part in future drug development techniques.
About the Authors
Corresponding Author
Maisaa Al-Wohhaib
Department of Medical Laboratory Sciences, Kuwait University, Kuwait City, Kuwait
- Email:
- maisaa.alwohhaib@ku.edu.kw
References
- Tzahar E, Waterman H, Chen X, Levkowtiz G, et al. (1996) A hierarchical network of interreceptor interactions determines signal transduction by Neu differentiation factor/neuregulin and epidermal growth factor. Mol. Cell. Biol. 16: 5276-5287.
[Crossref] [Google Scholar] [PubMed]
- Moasser MM (2007) The oncogene HER2: Its signaling and transforming functions and its role in human cancer pathogenesis. Oncogene. 26: 6469-6487.
[Crossref] [Google Scholar] [PubMed]
- Ursini-Siegel J, Schade B, Cardiff RD and Muller WJ (2007) Insights from transgenic mouse models of ERBB2-induced breast cancer. Nat. Rev. Cancer. 7: 389-397.
[Crossref] [Google Scholar] [PubMed]
- Gutierrez C and Schiff R (2011) HER2: Biology, detection, and clinical implications. Arch. Pathol. Lab. Med. 135: 55-62.
[Crossref] [Google Scholar] [PubMed]
- Seol H, Lee HJ, Choi Y, Lee HE, et al. (2012) Intratumoral heterogeneity of HER2 gene amplification in breast cancer: its clinicopathological significance. Mod. Pathol. 25: 938-948.
[Crossref] [Google Scholar] [PubMed]
- Mohanty SS, Sahoo CR and Padhy RN. (2020) Role of hormone receptors and HER2 as prospective molecular markers for breast cancer: An update. Genes. Dis. 9: 648-658.
[Crossref] [Google Scholar] [PubMed]
- Bergstein I (1999) Molecular Alterations in Breast Cancer. In: Breast Cancer. Contemporary Cancer Research (Bowcock AM, eds.). Humana Press, Totowa, NJ.
- Yamashita H, Ishida N, Hatanaka Y and Hagio K (2020) HER2 Gene Amplification in ER-positive HER2 Immunohistochemistry 0 or 1+ Breast Cancer With Early Recurrence. Anticancer. Res. 40: 645-652.
[Crossref] [Google Scholar] [PubMed]
- Ellsworth RE, Ellsworth DL, Patney HL and Deyarmin B (2008). Amplification of HER2 is a marker for global genomic instability. BMC. Cancer. 8: 297.
[Crossref] [Google Scholar] [PubMed]
- Sestak I and Cuzick J (2015) Markers for the identification of late breast cancer recurrence. Breast. Cancer. Res. 17: 10.
[Crossref] [Google Scholar] [PubMed]
- Sestak I, Dowsett M, Zabaglo L and Lopez-Knowles E (2013). Factors predicting late recurrence for estrogen receptor-positive breast cancer. J. Natl. Cancer. Inst. 105: 1504-1511.
[Crossref] [Google Scholar] [PubMed]
- Yamashita H, Ogiya A, Shien T, Horimoto Y, et al. (2016) Clinicopathological factors predicting early and late distant recurrence in estrogen receptor-positive, HER2-negative breast cancer. Breast. Cancer. 23: 830-843.
[Crossref] [Google Scholar] [PubMed]
- Davies C, Godwin J, Gray R, Clarke M, et al. (2011) Relevance of breast cancer hormone receptors and other factors to the efficacy of adjuvant tamoxifen: Patient-level meta-analysis of randomised trials. Lancet. 378: 771-784.
[Crossref] [Google Scholar] [PubMed]
- Tyburski H, Karakas C, Finkelman BS, Turner BM, et al. (2023) In ER-positive, HER2-negative breast cancers, HER2 mrna levels correlate better with clinicopathologic features and oncotype DX recurrence score than HER2 immunohistochemistry. Lab. Invest. 104: 100309.
[Crossref] [Google Scholar] [PubMed]
- Wolff AC, Hammond ME, Schwartz JN, Hagerty KL, et al. (2007) American Society of Clinical Oncology/College of American Pathologists guideline recommendations for human epidermal growth factor receptor 2 testing in breast cancer. Arch. Pathol. Lab. Med. 131: 18-43.
[Crossref] [Google Scholar] [PubMed]
- Sauter G, Lee J, Bartlett JM, Slamon DJ, Press MF. (2009) Guidelines for human epidermal growth factor receptor 2 testing: biologic and methodologic considerations. J. Clin. Oncol. 27: 1323-1333.
[Crossref] [Google Scholar] [PubMed]
- Mitas M, Mikhitarian K, Walters C, Baron PL, et al. (2001) Quantitative real-time RT-PCR detection of breast cancer micrometastasis using a multigene marker panel. Int. J. Cancer. 93: 162-171.
[Crossref] [Google Scholar] [PubMed]
- Bernard PS, Wittwer CT (2002) Real-time PCR technology for cancer diagnostics. Clin. Chem. 48: 1178-1185.
[Google Scholar] [PubMed]
- Alawadhi E, Al-Awadi A, Elbasmi A, Coleman MP, et al. (2019) Cancer survival by stage at diagnosis in Kuwait: A population-based study. J. Oncol. 2019: 8463195.
[Crossref] [Google Scholar] [PubMed]
- Al-Shamsi HO, Abdelwahed N, Abyad A, Abu-Gheida I, et al. (2023) Breast Cancer in the Arabian Gulf Countries. Cancers (Basel). 15: 5398.
[Crossref] [Google Scholar] [PubMed]
- Sadia H, Bhinder MA, Irshad A, Zahid B, et al. (2020) Determination of expression profile of p53 gene in different grades of breast cancer tissues by real time PCR. Afr. Health. Sci. 20: 1273-1282.
[Crossref] [Google Scholar] [PubMed]
- Livak KJ, Schmittgen TD (2001) Analysis of relative gene expression data using real-time quantitative PCR and the 2- ΔΔCT method. Methods. 25: 402-408.
[Crossref] [Google Scholar] [PubMed]
- Dunn OJ, Clark VA (1986) Applied statistics: analysis of variance and regression. 3rd Edition. John Wiley & Sons, Inc.
- Benöhr P, Henkel V, Speer R, Vogel U, et al. (2005). Her-2/neu expression in breast cancer-A comparison of different diagnostic methods. Anticancer. Res. 25: 1895-1900.
[Google Scholar] [PubMed]
- Kulka J, Tôkés AM, Kaposi-Novák P, Udvarhelyi N, et al. (2006) Detection of HER-2/neu gene amplification in breast carcinomas using quantitative real-time PCR - a comparison with immunohistochemical and FISH results. Pathol. Oncol. Res. 12: 197-204.
[Crossref] [Google Scholar] [PubMed]
- Tsuda H. (2006) HER-2 (c-erbB-2) test update: Present status and problems. Breast. Cancer. 13: 236-248.
[Crossref] [Google Scholar] [PubMed]
- Dobson L, Conway C, Hanley A, Johnson A, et al. (2010) Image analysis as an adjunct to manual HER-2 immunohistochemical review: A diagnostic tool to standardize interpretation. Histopathology. 57: 27-38.
[Crossref] [Google Scholar] [PubMed]
- Ahn S, Woo JW, Lee K, Park SY (2020) HER2 status in breast cancer: Changes in guidelines and complicating factors for interpretation. J. Pathol. Transl. Med. 54: 34-44.
[Crossref] [Google Scholar] [PubMed]
- Yi Z, Rong G, Guan Y, Li J, et al. (2020) Molecular landscape and efficacy of HER2-targeted therapy in patients with HER2-mutated metastatic breast cancer. NPJ. Breast. Cancer. 6: 59.
[Crossref] [Google Scholar] [PubMed]
- Owens MA, Horten BC, Da Silva MM (2004) HER2 amplification ratios by fluorescence in situ hybridization and correlation with immunohistochemistry in a cohort of 6556 breast cancer tissues. Clin. Breast. Cancer. 5: 63-69.
[Crossref] [Google Scholar] [PubMed]
- Murthy SK, Magliocco AM, Demetrick DJ (2005) Copy number analysis of c-erb-B2 (HER-2/neu) and topoisomerase IIalpha genes in breast carcinoma by quantitative real-time polymerase chain reaction using hybridization probes and fluorescence in situ hybridization. Arch. Pathol. Lab. Med. 129: 39-46.
[Crossref] [Google Scholar] [PubMed]
- Zoppoli G, Garuti A, Cirmena G, di Cantogno LV, et al. (2017) HER2 assessment using quantitative reverse transcriptase polymerase chain reaction reliably identifies Her2 overexpression without amplification in breast cancer cases. J. Transl. Med. 15: 91.
[Crossref] [Google Scholar] [PubMed]
Keywords:
Download:
Full PDF- Share This
