Dynamism of the breeding program for irrigated rice in Southeast Brazil
Received: March 22, 2019
Accepted: April 10, 2019
Published: May 05, 2019
Genet.Mol.Res. 19(5):
Keywords
Oryza sativa; Biometry; Genetic progress; Breeding program.
Introduction
The breeding program for flooded rice in Minas Gerais is carried out by the Empresa de Pesquisa Agropecuária de Minas Gerais (EPAMIG) in partnership with Embrapa-National Center for Research on Rice and Beans (CNPAF) and Federal University of Lavras (UFLA) (Santos et al., 1999). Because of this partnership, 31 rice cultivars were available in Minas Gerais, of which eighteen are suitable for crops irrigated in floodplain and thirteen for rainfed conditions.
The strategy for this success is to obtain, gradually, genetic gains but preserving the genetic variability for continuous improvement of productivity, grain quality, resistance to diseases and other agronomic characteristics (Breseghello et al., 2011; Colombari Filho et al., 2013; Martínez et al., 2014 Morais Júnior et al., 2017; Barros et al., 2018). Another important impact of the program is the high rate of adoption of new rice cultivars by farmers, which in itself portrays the efficiency of the breeding program (Soares et al., 1999). However, it is of the utmost importance to monitor the efficiency of the breeding program over time, providing quantitative indicators to correct directions and point out new strategies (Breseghello et al., 2011).
One way of quantifying the efficiency of the breeding program is by assessing the genotypic replacement rate that expresses the dynamics of the breeding program by providing the percentage of genotype taxa included, excluded, maintained and renewed from year to year (Cruz, 2003). The dynamics established by the inclusion, exclusion and renewal of cultivars is the most efficient way to evaluate the performance of the breeding program (Federizzi et al., 2012 and Ceccarelli, 2015).
We can summarize the dynamics of a breeding program through the indicator that expresses genetic progress. This information, in addition to verifying the success of the breeding program, quantifies the impact of favorable allele transfer strategies during the selection process, guides future research and re-evaluates the methods used to obtain new varieties (Soares et al., 2005; Menezes Júnior et al., 2008; Streck et al., 2018). Finally, global estimates of gains are useful as indicators of the effectiveness of the choice and conduct of the methodology used, as well as the potential of the exploited germplasm (Breseghello et al., 2011).
In evaluating the performance of the breeding program it should be considered that it involves large investments, financial, physical and human, in the long term and that the decisions taken punctual will show its consequences years later in the performance of the resulting cultivars. However, achievements can help predict trends and plan future breeding program adjustments.
In the literature, there are few studies related to the genotypic substitution rate in cerals, with for example wheat (Carginin et al., 2008; Follmann et al., 2017) and rice (Atroch et al., 2000; Reis et al., 2015). In view of the above, the objective of this work was to estimate the genotypic replacement rate during the period from 1993 to 2016 to evaluate the dynamics of the genetic improvement program of flooded rice in Minas Gerais.
Materials and Methods
Description of the field experiments
The experiments were carried out in the state of Minas Gerais, Brazil, in the experimental fields of Empresa de Pesquisa Agropecuária de Minas Gerais (EPAMIG) in the municipalities of Leopoldina (latitude 21° 31' 48.01'' S, longitude 42° 38' 24.00'' W), Lambari (latitude 21° 58' 11.24''S, longitude 45°20' 59.60'' W) and Janaúba (latitude 15° 48' 0.77'' S, longitude 43° 17' 59.09'' W). A total of 210 lines were evaluated for grain yield (t.ha-1) between 1993 and 2016. In each experiment, 25 lines were evaluated, with the exception of the years 1994, 1995 and 1999, for which 12, 24 and 26 lines were evaluated, respectively (Table 1).
| Years Agricultural |
Repetitions | Númber of Lineages | Size of the Plotion (m) |
Total área of portion (m2) |
Useful área of portion (m2) |
|---|---|---|---|---|---|
| 1993/94 | 4 | 12 | 5 x 1,50 | 7,5 | 3,6 |
| 1994/95 | 4 | 24 | 5 x 1,50 | 7,5 | 3,6 |
| 1995/96 | 4 | 25 | 5 x 1,50 | 7,5 | 3,6 |
| 1996/97 | 4 | 25 | 5 x 1,50 | 7,5 | 3,6 |
| 1997/98 | 4 | 25 | 5 x 1,50 | 7,5 | 3,6 |
| 1998/99 | 4 | 26 | 5 x 1,50 | 7,5 | 3,6 |
| 1999/00 | 4 | 25 | 5 x 1,50 | 7,5 | 3,6 |
| 2001/02 | 4 | 25 | 5 x 1,80 | 9,0 | 4,8 |
| 2002/03 | 3 | 25 | 5 x 1,80 | 9,0 | 4,8 |
| 2003/04 | 3 | 25 | 5 x 1,80 | 9,0 | 4,8 |
| 2004/05 | 3 | 25 | 5 x 1,80 | 9,0 | 4,8 |
| 2005/06 | 3 | 25 | 5 x 1,80 | 9,0 | 4,8 |
| 2006/07 | 3 | 25 | 5 x 1,50 | 9,0 | 4,8 |
| 2007/08 | 3 | 25 | 5 x 1,50 | 7,5 | 3,6 |
| 2008/09 | 3 | 25 | 5 x 1,50 | 7,5 | 3,6 |
| 2009/10 | 3 | 25 | 5 x 1,50 | 7,5 | 3,6 |
| 2010/11 | 3 | 25 | 5 x 1,50 | 7,5 | 3,6 |
| 2012/13 | 3 | 25 | 5 x 1,50 | 7,5 | 3,6 |
| 2013/14 | 3 | 25 | 5 x 1,50 | 7,5 | 3,6 |
| 2014/15 | 3 | 25 | 5 x 1,50 | 7,5 | 3,6 |
| 2015/16 | 3 | 25 | 5 x 1,50 | 7,5 | 3,6 |
Table 1: Information from the Value and Cultivation and Use (VCU's) tests conducted from 1994 to 2016 in Minas Gerais.
All experiments were conducted in randomized blocks with four replications each until 2002. From that year on, the same design was used, but with three replications. The experimental plots from 1993 to 1999 and from 2000 to 2016 consisted of 5-m-long rows. The plots were composed of five lines with 0.30-m spacing between rows. The harvest area was composed of 3 internal rows to exclude any border effects. From 2001 to 2007, the plots were composed of six rows, and the four central meters of the five internal rows were considered. The irrigation level was gradually increased as the plants developed. The experiments were conducted in agreement with the technical recommendations of the crop (Empresa brasileira de pesquisa agropecuária, 1997). Emphasis was given to the grain yield character in Kg.ha-1, since this is the main characteristic evaluated in breeding programs. For the analysis of genotype performance, the GENES software (Cruz, 2016) was used.
Number and average of genotypes included, maintained and excluded each year
From a set of information related to the performance of a genotype group evaluated in a given period of time the following information is obtained:
I: number of new genotypes in relation to the previous year. For year 1 we have I equal to zero. For the other years, we have:
Ii = nij-ni,j-1 Equation 1
where: nij: number of genotypes evaluated in year i; nij = nj,i:, i: number of genotypes evaluated in year i and j.
M: number of genotypes kept for evaluation in the following year:
Mi=ni,j+1 Equation 2
For the last year (i = a) we have: Ma = naa.
E: number of genotypes excluded from the evaluation in the following year:
Ei=nii-ni,i+1 Equation 3
For the last year (i = a) we have: Ea = 0.
T: number of genotypes evaluated in the year. Ti = nii
MI: mean of new (renewed) genotypes in relation to the previous year. For the first year, mean is zero (MIa = 0).
MM: mean of the genotypes kept for evaluation in the subsequent year.
ME: mean of the genotypes excluded from the evaluation in the subsequent year. For the last year, mean is zero (MEa = 0).
MT: Mean of all genotypes evaluated in the year.
Genotypic replacement rate
The genotypic replacement rate quantifies the dynamism of the breeding program, providing the rate of genotypes included, excluded, maintained and renewed from year to year. In this case, it is considered:
M: Number of genotypes kept from year to year. For years 1 and 2, we have:
E: Número de genótipos excluídos no ano anterior. Para os anos 1 e 2, tem-se:
I: Number of genotypes included in the subsequent year. In terms of years 1 and 2, we have:
To estimate the percentage:
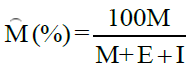 Equation 4
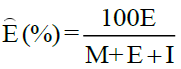 Equation 5
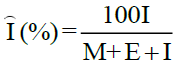 Equation 6
The rate of new genotypes included by the breeding program over the previous year (% I) is also a measure of breeding program dynamism. The percentage of renewal (% R), which expresses the rate of new genotypes among those being tested in a given year, is given by:
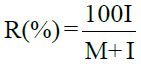 Equation 7
Results
The level of adoption of cultivars by farmers is certainly the most efficient qualitative way of evaluating the performance of a plant breeding program. However, even in programs of proven success, quantitative indicators are needed that allow, for example, evaluation of the genotypic replacement rate using experimental data, such as those available from VCU assays. In this context, and taking advantage of the results of evaluation of grain yield of the network of VCU's trials, it was possible to evaluate the dynamism of the flood-irrigated rice breeding program developed in Minas Gerais from 1993/94 to 2015/16 (Table 2).
| Year | Lambari | Janaúba | Leopoldina | |||||||||
|---|---|---|---|---|---|---|---|---|---|---|---|---|
| I | E | M | R | I | E | M | R | I | E | M | R | |
| 02/01 | 0.65 | 0.29 | 0.06 | 0.92 | 0.65 | 0.29 | 0.06 | 0.92 | 0.65 | 0.29 | 0.06 | 0.92 |
| 03/02 | 0.31 | 0.31 | 0.37 | 0.46 | 0.31 | 0.31 | 0.37 | 0.46 | 0.31 | 0.31 | 0.37 | 0.46 |
| 04/03 | 0.48 | 0.46 | 0.07 | 0.88 | 0.48 | 0.46 | 0.07 | 0.88 | 0.48 | 0.46 | 0.07 | 0.88 |
| 05/04 | 0.49 | 0.49 | 0.02 | 0.96 | 0.49 | 0.49 | 0.02 | 0.96 | 0.49 | 0.49 | 0.02 | 0.96 |
| 06/05 | 0.44 | 0.44 | 0.11 | 0.8 | 0.31 | 0.28 | 0.42 | 0.42 | 0.31 | 0.28 | 0.42 | 0.42 |
| 07/06 | 0.42 | 0.42 | 0.16 | 0.72 | 0.41 | 0.43 | 0.16 | 0.72 | 0.41 | 0.43 | 0.16 | 0.72 |
| 08/07 | 0.19 | 0.19 | 0.61 | 0.24 | 0.42 | 0.42 | 0.16 | 0.72 | 0.42 | 0.42 | 0.16 | 0.72 |
| 09/08 | 0.34 | 0.34 | 0.32 | 0.52 | 0.19 | 0.19 | 0.61 | 0.24 | 0.19 | 0.19 | 0.61 | 0.24 |
| 10/09 | 0.22 | 0.22 | 0.56 | 0.28 | 0.38 | 0.38 | 0.25 | 0.6 | 0.34 | 0.34 | 0.32 | 0.52 |
| 11/10 | 0.34 | 0.34 | 0.32 | 0.52 | - | - | - | - | 0.22 | 0.22 | 0.56 | 0.28 |
| 12/11 | 0.11 | 0.11 | 0.79 | 0.12 | 0.34 | 0.34 | 0.32 | 0.52 | 0.34 | 0.34 | 0.32 | 0.52 |
| 13/12 | 0.31 | 0.31 | 0.39 | 0.44 | 0.11 | 0.11 | 0.79 | 0.12 | 0.11 | 0.11 | 0.79 | 0.12 |
| 14/13 | 0.14 | 0.14 | 0.72 | 0.16 | 0.31 | 0.31 | 0.39 | 0.44 | 0.31 | 0.31 | 0.39 | 0.44 |
| 15/14 | 0.29 | 0.29 | 0.43 | 0.4 | 0.14 | 0.14 | 0.72 | 0.16 | 0.14 | 0.14 | 0.72 | 0.16 |
| 16/15 | 0.07 | 0.07 | 0.85 | 0.08 | 0.29 | 0.29 | 0.43 | 0.4 | 0.29 | 0.29 | 0.43 | 0.4 |
| 17/16 | 0.34 | 0.34 | 0.32 | 0.52 | 0.07 | 0.07 | 0.85 | 0.08 | 0.07 | 0.07 | 0.85 | 0.08 |
| 18/17 | 0.22 | 0.22 | 0.56 | 0.28 | 0.34 | 0.34 | 0.32 | 0.52 | 0.34 | 0.34 | 0.32 | 0.52 |
| 19/18 | 0.19 | 0.19 | 0.61 | 0.24 | 0.22 | 0.22 | 0.56 | 0.28 | 0.22 | 0.22 | 0.56 | 0.28 |
| 20/19 | 0.22 | 0.22 | 0.56 | 0.28 | 0.19 | 0.19 | 0.61 | 0.24 | 0.19 | 0.19 | 0.61 | 0.24 |
| 21/20 | - | - | - | 0.22 | 0.22 | 0.56 | 0.28 | 0.22 | 0.22 | 0.56 | 0.28 | |
| Average | 0.31 | 0.29 | 0.39 | 0.44 | 0.31 | 0.29 | 0.4 | 0.44 | 0.31 | 0.29 | 0.4 | 0.43 |
I: Number of new genotypes in relation to the previous year; M: Number of genotypes maintained for evaluation in the subsequent year; E: Number of genotypes excluded from the evaluation in the subsequent year; T: Number of genotypes evaluated in the year.
Table 2: Genotype replacement rate (%) in Value for Cultivation and Use (VCU) testing of irrigated rice in each pair of years, from 1993 to 2016 in Minas Gerais, Brazil.
The process of indication of varieties for commercial plantations is continuous and dynamic and, thus, periodically recommend new cultivars in substitution to those less productive and with less commercial acceptance. Table 2 provides indicators to quantify the dynamism of the irrigated rice breeding program in the state of Minas Gerais. The number of genotypes excluded from the evaluation in the following year, number of genotypes evaluated in the year, average of new genotypes (renewed) in relation to the previous year, mean of the genotypes kept for evaluation in the following year, average of the genotypes excluded from the evaluation in the subsequent year and the average of the genotypes evaluated in the year of the VCU's.
The average grain yield of the genotypes evaluated in the periods from 1993 to 2016 was 3631 kg.ha-1 in Lambari. At this location, the highest average of all evaluated genotypes was recorded in the agricultural year 2002/2003, which corresponds to 6812 kg.ha-1 and the lowest 2465 kg.ha-1 in the 2010/11 agricultural year (Table 3). In Janaúba and Leopoldina, the average results of the genotypes were better than Lambari, since in Janaúba and Leopoldina the overall mean reached 6282 kg.ha-1 and 5790 kg.ha-1, respectively (Table 3).
| Year | Lambari | Janaúba | Leopoldina | |||||||||
|---|---|---|---|---|---|---|---|---|---|---|---|---|
| MI | MM | ME | MT | MI | MM | ME | MT | MI | MM | ME | MT | |
| 1994 | - | 2158 | 1863 | 1912 | - | 1009 | 9973 | 9993 | - | 7186 | 6909 | 6955 |
| 1995 | 4584 | 4516 | 4307 | 4420 | 8003 | 8412 | 7673 | 8073 | 7459 | 7827 | 7126 | 7506 |
| 1996 | 4842 | 5295 | 5027 | 5060 | 7427 | 7491 | 7624 | 7607 | 5680 | 5443 | 5656 | 5629 |
| 1997 | 3449 | 4069 | 3372 | 3400 | 6666 | 6336 | 6687 | 6673 | 5643 | 5668 | 5662 | 5662 |
| 1998 | 4492 | 4937 | 4381 | 4492 | 6253 | 6446 | 6037 | 6282 | 5318 | 5687 | 4768 | 5320 |
| 1999 | - | - | - | 3059 | 6391 | 6550 | 6389 | 6432 | 5689 | 5683 | 5880 | 5827 |
| 1991 | 3026 | 3136 | 3030 | 2903 | 6387 | 6391 | 6387 | 6388 | 5270 | 5609 | 5270 | 5365 |
| 2002 | 2766 | 3039 | 2471 | 6812 | 8313 | 8308 | 8191 | 8280 | 5282 | 5378 | 5585 | 5427 |
| 2003 | 7213 | 6655 | 6957 | 1282 | 6182 | 5937 | 6326 | 6170 | 6060 | 5538 | 5146 | 5334 |
| 2004 | 1429 | 1238 | 1397 | 2745 | 5191 | 5213 | - | 5213 | 5601 | 6112 | 4964 | 5790 |
| 2005 | 2879 | 3172 | 2351 | 2309 | - | 4115 | 3979 | 4044 | 6141 | 6532 | 5757 | 6129 |
| 2006 | 1940 | 2468 | 1148 | 4575 | 6978 | 6747 | 6268 | 6689 | 7007 | 7138 | 6265 | 7033 |
| 2007 | 5057 | 5096 | 3912 | 2189 | 5773 | 5675 | 5156 | 5447 | 8435 | 8185 | 7574 | 7916 |
| 2008 | 2277 | 2349 | 1345 | 4269 | 8282 | 8409 | 7812 | 8314 | 6057 | 6612 | 5294 | 6401 |
| 2009 | 4820 | 4239 | 4313 | 4892 | 3894 | 3443 | 3681 | 3538 | 4076 | 4039 | 4036 | 4038 |
| 2010 | 4885 | 4878 | 5046 | 2465 | 5465 | 5446 | 4904 | 5403 | 5814 | 5944 | 5701 | 5924 |
| 2011 | 8733 | 9625 | 8653 | 5468 | 6135 | 6466 | 6483 | 6475 | 4391 | 5071 | 4803 | 4932 |
| 2013 | 5280 | 5455 | 5500 | 3862 | 4248 | 4171 | 4251 | 4194 | 3903 | 4093 | 3700 | 3983 |
| 2014 | 3997 | 3966 | 3532 | 4600 | 5601 | 5427 | 5438 | 5430 | 2708 | 2647 | 2753 | 2673 |
| 2015 | 5043 | 4773 | 4157 | 2808 | 5352 | 5695 | 5303 | 5585 | 7744 | 7646 | 7654 | 7648 |
| 2016 | 2989 | 2808 | - | - | 6008 | 5990 | - | 5990 | 7085 | 6854 | - | 6854 |
MI: Mean of new (renewed) genotypes in relation to the previous year; MM: Mean of the genotypes maintained for evaluation in the subsequent year; ME: Mean of the genotypes excluded from the evaluation in the subsequent year; MT: Mean of the total genotypes evaluated in the year.
Table 3: Characterization of the tests performed for different genotype means.
The highest total average of the genotypes corresponds to 8314 kg.ha-1 in the crop year 2007/08, in the Janaúba. In this same place, the lowest mean was 3538 kg.ha-1 in the 2008/09 crop year. In Leopoldina, the highest average was 7916 kg.ha-1 agricultural year of 2006/07 and the lowest average of 2673 kg.ha-1 agricultural year 2013/14 (Table 3). In spite of the low total averages, Lambari was the site that obtained the highest average of the new genotypes in relation to the previous year (8733 kg.ha-1), and also the highest average of the genotypes excluded from the evaluation in the following year (8653 kg.ha- 1) (Table 3).
From the point of view of rigor in the improvement of irrigated rice in Minas Gerais, the agricultural years 1993/1994 to 1999/2000, obtained a greater number of new genotypes in relation to the previous year and the smaller number of genotypes kept for evaluation in the year (Table 2), and, consequently, higher was required for the breeder's requirement in this period for the evaluation of genotypes. It was verified that the Irrigated Rice Improvement Program in the State of Minas Gerais promoted a good genotype renewal rate throughout the evaluated period (Table 2), demonstrating the program's dynamism in launching cultivars, providing new crop options for the orizicultor. Similar results were found in other works such as Carginin, et al., 2008 in wheat, obtained 33% renewal rate and Soares et al., 1999; Atroch and Nunes, 2000 in rice, found rates of renewal of 44% and 46% respectively, these authors reported that the values found evidence high vitality of breeding programs.
In general, the genotype maintenance rate in this study is considered average (Table 2). Branquinho et al., 2016 obtained a result of 25%, considered low. Already Soares et al., 1999 and Dovale et al., 2012 obtained good results (56% and 58%, respectively). Atroch and Nunes (2000) verified an average maintenance rate of 38% in the period from 1997/98 to 2011/12 and Reis et al., 2015 obtained a mean maintenance rate of 63% in rice. In other crops, such as cotton Moresco, 2003 and wheat (Carginin et al., 2008), average maintenance rates of 44% and 55%, respectively, were found to be optimal.
From the point of view of rigor in the improvement of irrigated rice in Minas Gerais, the agricultural years 1993/1994 to 1999/2000, obtained a greater number of new genotypes in relation to the previous year and the smaller number of genotypes kept for evaluation in the year (Table 2), and, consequently, higher was required for the breeder's requirement in this period for the evaluation of genotypes. It was verified that the Irrigated Rice Improvement Program in the State of Minas Gerais promoted a good genotype renewal rate throughout the evaluated period (Table 2), demonstrating the program's dynamism in launching cultivars, providing new crop options for the orizicultor. Similar results were found in other works such as Carginin, et al., 2008, in wheat, obtained 33% renewal rate and Soares et al., 1999; Atroch and Nunes 2000 in rice, found rates of renewal of 44% and 46% respectively, these authors reported that the values found evidence high vitality of breeding programs.
The effectiveness of an improvement program is also related to the inclusion and exclusion rate. When the inclusion rate is higher in relation to the exclusion, it indicates that the breeding program is contributing to the release of the varieties, allowing new cultivation options for the farmer (Cruz, 2003). In all places, the mean inclusion was higher than the average exclusion, indicating good efficiency of the irrigated rice breeding program in Minas Gerais (Table 2).
The mean maintenance rates were 39% in Lambari and 40% in Janaúba and Leopoldina (Table 2). The lowest maintenance rate in Lambari compared to other locations is due to the analysis being made with different farm years, since 20 years of agricultural production were evaluated in Lambari, while in the other locations 21 agricultural years were evaluated. This makes it possible to obtain an estimate of the variation of the environment between the years under evaluation. In this sense, the environmental effect is due to the contrast between the genotypes common to the years considered (Atroch and Nunes, 2000). The greater the number of common treatments every couple of years, the more accurate is the environmental effect estimate. Thus, the data analysis leads to greater safety in the estimation of genetic progress by the consequent reduction caused by the experimental errors and the interactions of genotypes with years.
Discussion
This difference between sites is due to the representative effect of a complex set of factors acting at random. This involves climatic factors, incidence of pests and diseases as well as factors peculiar to certain moments in time and space. Thus, it is not expected, contrary to the directed action of the improvement, a favorable temporal action of the environment over the years. Another explanation is that the best genotype in one location may not be the best in another, that is, differentiated behavior of genotypes versus environmental variations, because of this difference between environment, which expresses the interaction genotypes by environments (Colombari Filho, et al., 2013 and Kleinknecht et al., 2016). However, in addition to the productivity that the genotype-environment interaction is visible, it is worth noting that the attributes related to irrigated rice grain quality are highly related not only to genetic but also environmental factors (Cameron et al., 2008; Hakata et al., 2012; Lyman et al. 2013, Li et al., 2014, Xu et al., 2015; Streck et al., 2017; Streck et al., 2018). The physical attributes of the grains are very complex quantitative traits because they are controlled by maternal and cytoplasmic effects (Streck et al., 2018). Therefore, many genetic mechanisms and interactions with the environment are still obscure (Shi et al., 2012; Zhou et al., 2009).
It is important to note that, in all places, the general averages were higher than the average in the state of Minas Gerais during the period from 1993 to 2016. Therefore, the program of improvement of irrigated rice in Minas Gerais provides a great contribution of cultivars to the rice farmer. In this sense, the first cultivar recommended for the State was IR 841 in 1975 and in the agricultural year 1976/1977 the production in the State with this cultivar was 897 kg.ha-1. The first variety of rice launched by the rice improvement program in Minas Gerais was in fact the IAC 899 variety in 1978 and in the first agricultural year after its launch the productivity obtained in the state was approximately 1300 kg.ha-1 showing the efficiency of the rice improvement program in the state (Companhia Nacional de Abastecimento, 2016).
Reis et al., 2015 evaluated 108 genotypes of flooded rice in the period 1997/1998 to 2011/2012 in the VCU's tests of the Empresa de Pesquisa Agropecuária de Minas Gerais (EPAMIG) of the irrigated rice breeding program. According to these authors there was balance in the irrigated rice improvement of the EPAMIG program regarding the inclusion and exclusion of materials in this study.
An important caveat that must take into account the high maintenance rates that limit genetic gains to rice productivity, mainly due to the low exploitation of the genetic base for the crop available in germplasm banks, and also because this characteristic is quantitative (Streck et al., 2018), that is, controlled by many genes. This restricts the potential for genotypic variability of elite materials to be explored. An ideal situation was that replacement rates were equal to or even higher than that observed in the period 1998 to 2012, which was 26% (Reis et al., 2015). In view of these results, new strategies should be used in the breeding program of irrigated rice in Minas Gerais to increase the genetic base of the lineages, as well as increase in the rate of replacement and reduction in the rate of maintenance and selection in a specific environment.
Conclusion
The genetic improvement program of irrigated rice developed in Minas Gerais in the agricultural years from 1993/1994 to 2015/2016 was dynamic. Although the results are satisfactory, new strategies should be used in the breeding program of irrigated rice in Minas Gerais to increase the genetic base of the lineages, as well as increase in the rate of replacement and reduction in the rate of maintenance and selection in specific environment.
Acknowledgments
The authors thank the FAPEMIG, CNPq and CAPES for the financial support and researcher at the Embrapa Rice and Beans Dr. Orlando Peixoto de Morais (in memory) and Paula Pereira Torga. This study was financed in part by the Coordenação de Aperfeiçoamento de Pessoal de Nível Superior – Brasil (CAPES) – Finance Code 001.
About the Authors
Corresponding Author
A.C. Silva Júnior
Department of General Biology, Federal University of Viçosa, Viçosa, Minas Gerais, Brazil
References
- Atroch AL and Nunes GHS (2000) Progresso genético em arroz de várzea úmida no Estado do Amapá. Pesquisa Agropecuária Brasileira, Brasília 35: 767-771. https://doi.org/10.1590/s0100-204x2000000400013
- Barros MS, Morais Júnior OP, Melo PGS, et al. (2018) Effectiveness of early-generation testing applied to uplandrice breeding. Euphytica 214: 61. https://doi.org/10.1007/s10681-018-2145-z
- Branquinho RG (2016) Regionalização de áreas produtoras de arroz de terras altas e dimensionamento de sua rede experimental para avaliação genotípica. 117 f. Tese (Doutorado em Genética e Melhoramento de Plantas)–Escola de Agronomia e Engenharia de Alimentos, Universidade Federal de Goiás.
- Breseghello F, Morais OP, Pinheiro PV, Silva ACS, et al. (2011) Results of 25 years of upland rice breeding in Brazil. Crop Science 51: 914-923. https://doi.org/10.2135/cropsci2010.06.0325
- Cameron DK, Wang YJ, Moldenhauer KA (2008) Comparison of physical and chemical properties of medium-grain rice cultivars grown in California and Arkansas. Journal of Food Science 73: 72-78. https://doi.org/10.1111/j.1750-3841.2007.00631.x
- Carginin A, Souza MA, Fronza V (2008) Progress in breeding of irrigated wheat for the Cerrado region of Brazil. Crop Breed. Appl Biotechnol 8: 39-46. https://doi.org/10.12702/1984-7033.v08n01a06
- Ceccarelli S (2015) Efficiency of Plant Breeding. Crop Science 55: 87-97. https://doi.org/10.2135/cropsci2014.02.0158
- Colombari Filho JM, Resende MDV, Morais OP, Castro AP, et al. (2013) Upland rice breeding in Brazil: a genotypic evaluation simultaneous for stability, adaptability and grain yield. Euphytica 192: 117-129. https://doi.org/10.1007/s10681-013-0922-2
- Companhia Nacional de Abastecimento (2016) Disponível em
- Cruz CD and Carneiro PCS (2003) Modelos biométricos aplicados ao melhoramento genético. Viçosa: Editora UFV 2: 585.
- Cruz CD (2016) Genes Software – extended and integrated with the R, Matlab and Selegen. Acta Scientiarum 38: 547-552. https://doi.org/10.4025/actasciagron.v38i3.32629
- Do Vale JC, Soares PC, Cornélio VMO, Reis MS, et al. (2012) Contribuição genética na produtividade do arroz irrigado em Minas Gerais no período de 1998 a 2010. Bragantia 71: 460-466. https://doi.org/10.1590/s0006-87052012000400002
- Empresa brasileira de pesquisa agropecuária (1997) Manual de métodos de pesquisa em arroz, 1ª aproximação. Goiânia-GO EMBRAPA/CNPAF 106.
- Federizzi LC, Carbonell S, Pacheco MT, Nava IC (2012) Breeders' work after cultivar development: the stage of recommendation. Crop Breed Appl Biotechnol 12: 67-74. https://doi.org/10.1590/s1984-70332012000500008
- Follmann DN, Cargnelutti Filho A, Lúcio AD, Souza VQ, et al. (2017) Genetic progress in homogeneous regions of wheat cultivation in Rio Grande do Sul State. Genetics and Molecular Research 16. https://doi.org/10.4238/gmr16019517
- Hakata M, Kuroda M, Miyashita T, Yamaguchi T, et al. (2012) Suppression of α-amylase genes improves quality of rice grain ripened under high temperature. Plant Biotechnology Journal 10: 1110-1117. https://doi.org/10.1111/j.1467-7652.2012.00741.x
- Kleinknecht K, Möhring J, Laidig F, Meyer U, et al. (2016) A simulation-based approach for evaluating the efficiency of multi-environment trial designs. Crop Science 56: 2237-2250. https://doi.org/10.2135/cropsci2015.07.0405
- Li JY, Wang J, Zeigler RS (2014) The 3,000 rice genomes project: new opportunities and challenges for future rice research. GigaScience 3: 1-3. https://doi.org/10.1186/2047-217x-3-8
- Lyman NB, Jagadish KS, Nalley LL, Dixon BL, et al. (2013) Neglecting rice milling yield and quality underestimates economic losses from high-temperature stress. Plos One 8: e72157. https://doi.org/10.1371/journal.pone.0072157
- Martínez CP, Torres EA, Chatel M (2014) Rice breeding in Latin America. In: Janick J. Plant Breeding Reviews Wiley 187-277.
- Menezes Júnior JAN, Ramalho MAP, Abreu AFB (2008) Seleção recorrente para três caracteres do feijoeiro. Bragantia 67: 833-838. https://doi.org/10.1590/s0006-87052008000400004
- Morais Júnior OP, F Breseghello, JB Duarte, OP Morais, et al. (2017) Effectiveness of Recurrent Selection in Irrigated Rice Breeding. Crop Science 57: 3043-3058. https://doi.org/10.2135/cropsci2017.05.0276
- Moresco ER (2003) Progresso genético no melhoramento do algodoeiro no Estado de Mato Grosso. Tese Doutorado Piracicaba 79. https://doi.org/10.11606/t.11.2003.tde-15072003-152149
- Reis GG, Fritsche-Neto R, Soares PC, Cornélio VMO, et al. (2015) Accuracy and genetic progress of agronomic traits in irrigated rice program in Brazil. African Journal of Agricultural Research 10: 4032-4038. https://doi.org/10.5897/ajar2014.9112
- Santos PG, Soares PC, Soares AA, Morais OP e Cornélio VMO (1999) Avaliação do progresso genético obtido em 22 anos no melhoramento do arroz irrigado em Minas Gerais. Pesquisa Agropecuária Brasileira 34: 1889-1896. https://doi.org/10.1590/s0100-204x1999001000016
- Shi CH, Wu JG, Lou XB, Zhu J, et al. (2012) Genetic analysis of transparency and chalkiness area at different filling stages of rice (Oryza sativa L.). Field Crops Research 76: 1-9. https://doi.org/10.1016/s0378-4290(02)00011-4
- Soares AA, Santos PG, Morais OP, Soares PC, Reis MS e Souza MA (1999) Progresso genético obtido pelo melhoramento do arroz de sequeiro em 21 anos de pesquisa em Minas Gerais. Pesquisa Agropecuária Brasileira 34: 415-424. https://doi.org/10.1590/s0100-204x1999000300013
- Soares PC, Melo PGS, Melo LC, Soares AA. (2005) Genetic gain in an improvement program of irrigated rice in Minas Gerais. Crop Breeding and Applied Biotechnology 5: 142-148. https://doi.org/10.12702/1984-7033.v05n02a03
- Streck EA, Aguiar GA, Magalhães Júnior AM, Facchinello PHK, et al. (2017) Variabilidade fenotípica de genótipos de arroz irrigado via análise multivariada. Revista Ciência Agronômica 48: 101-109. https://www.redalyc.org/pdf/1953/195347767011.pdf
- Streck, EA Magalhaes, AM Aguiar, GA Facchinello, PKH Fagundes, et al. (2018) Genetic Progress in 45 Years of Irrigated Rice Breeding in Southern Brazil. Crop Science 58: 1-12. https://doi.org/10.2135/cropsci2017.06.0383
- Xu, Q, Chen W, Xu Z (2015). Relationship between grain yield and quality in rice germplasms grown across different growing areas. Breeding Science 65: 226-232. https://doi.org/10.1270/jsbbs.65.226
- Zhou LJ, Jiang L, Zhai HQ, Wan JM (2009) Current status and strategies for improvement of rice grain chalkiness. Hereditas, 31: 563-572. https://doi.org/10.3724/sp.j.1005.2009.00563
Keywords:
Download:
Full PDF- Share This